European vs Guatemalan Median Male Earnings
COMPARE
European
Guatemalan
Median Male Earnings
Median Male Earnings Comparison
Europeans
Guatemalans
$57,637
MEDIAN MALE EARNINGS
95.6/ 100
METRIC RATING
111th/ 347
METRIC RANK
$46,736
MEDIAN MALE EARNINGS
0.0/ 100
METRIC RATING
305th/ 347
METRIC RANK
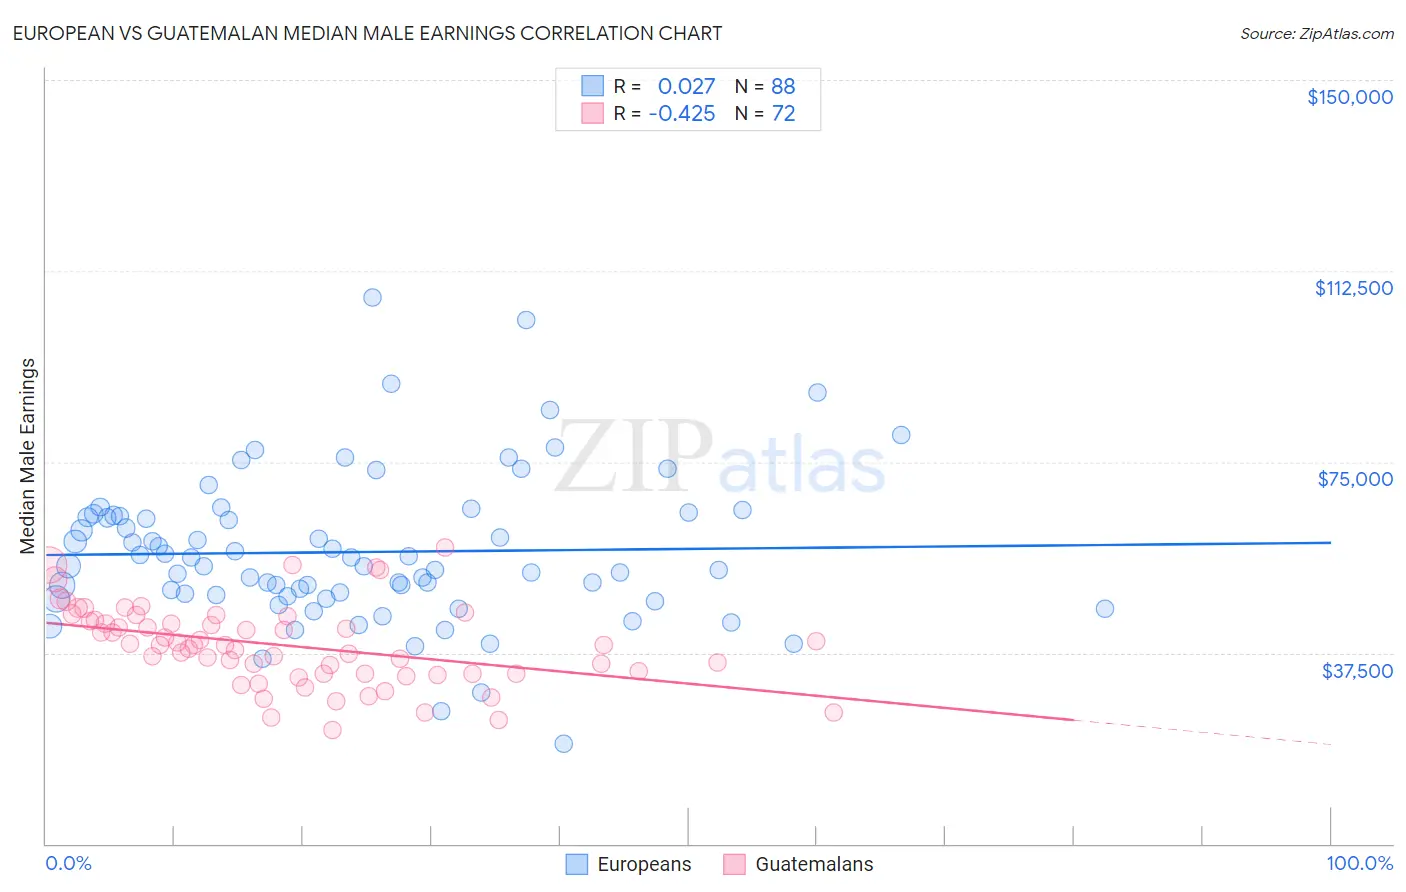
European vs Guatemalan Median Male Earnings Correlation Chart
The statistical analysis conducted on geographies consisting of 560,846,229 people shows no correlation between the proportion of Europeans and median male earnings in the United States with a correlation coefficient (R) of 0.027 and weighted average of $57,637. Similarly, the statistical analysis conducted on geographies consisting of 409,446,207 people shows a moderate negative correlation between the proportion of Guatemalans and median male earnings in the United States with a correlation coefficient (R) of -0.425 and weighted average of $46,736, a difference of 23.3%.
Median Male Earnings Correlation Summary
| Measurement | European | Guatemalan |
| Minimum | $19,583 | $22,332 |
| Maximum | $107,377 | $58,162 |
| Range | $87,794 | $35,830 |
| Mean | $57,294 | $38,925 |
| Median | $54,588 | $39,033 |
| Interquartile 25% (IQ1) | $48,703 | $33,424 |
| Interquartile 75% (IQ3) | $64,440 | $43,885 |
| Interquartile Range (IQR) | $15,737 | $10,461 |
| Standard Deviation (Sample) | $14,840 | $7,785 |
| Standard Deviation (Population) | $14,755 | $7,731 |
Similar Demographics by Median Male Earnings
Demographics Similar to Europeans by Median Male Earnings
In terms of median male earnings, the demographic groups most similar to Europeans are Immigrants from Afghanistan ($57,582, a difference of 0.090%), Carpatho Rusyn ($57,572, a difference of 0.11%), Immigrants from Kuwait ($57,562, a difference of 0.13%), Palestinian ($57,778, a difference of 0.25%), and Swedish ($57,445, a difference of 0.33%).
| Demographics | Rating | Rank | Median Male Earnings |
| Armenians | 97.3 /100 | #104 | Exceptional $58,134 |
| Immigrants | Western Asia | 97.3 /100 | #105 | Exceptional $58,131 |
| Immigrants | Northern Africa | 96.9 /100 | #106 | Exceptional $58,008 |
| Serbians | 96.8 /100 | #107 | Exceptional $57,975 |
| Immigrants | Uzbekistan | 96.7 /100 | #108 | Exceptional $57,941 |
| British | 96.5 /100 | #109 | Exceptional $57,890 |
| Palestinians | 96.2 /100 | #110 | Exceptional $57,778 |
| Europeans | 95.6 /100 | #111 | Exceptional $57,637 |
| Immigrants | Afghanistan | 95.4 /100 | #112 | Exceptional $57,582 |
| Carpatho Rusyns | 95.3 /100 | #113 | Exceptional $57,572 |
| Immigrants | Kuwait | 95.3 /100 | #114 | Exceptional $57,562 |
| Swedes | 94.8 /100 | #115 | Exceptional $57,445 |
| Lebanese | 94.6 /100 | #116 | Exceptional $57,409 |
| Immigrants | Zimbabwe | 94.3 /100 | #117 | Exceptional $57,352 |
| Hungarians | 94.0 /100 | #118 | Exceptional $57,309 |
Demographics Similar to Guatemalans by Median Male Earnings
In terms of median male earnings, the demographic groups most similar to Guatemalans are Bangladeshi ($46,744, a difference of 0.020%), Yaqui ($46,777, a difference of 0.090%), Seminole ($46,783, a difference of 0.10%), Dutch West Indian ($46,656, a difference of 0.17%), and Immigrants from Dominican Republic ($46,655, a difference of 0.17%).
| Demographics | Rating | Rank | Median Male Earnings |
| Immigrants | Micronesia | 0.1 /100 | #298 | Tragic $47,177 |
| Immigrants | Zaire | 0.1 /100 | #299 | Tragic $47,070 |
| U.S. Virgin Islanders | 0.1 /100 | #300 | Tragic $47,066 |
| Immigrants | Latin America | 0.1 /100 | #301 | Tragic $46,941 |
| Seminole | 0.1 /100 | #302 | Tragic $46,783 |
| Yaqui | 0.1 /100 | #303 | Tragic $46,777 |
| Bangladeshis | 0.1 /100 | #304 | Tragic $46,744 |
| Guatemalans | 0.0 /100 | #305 | Tragic $46,736 |
| Dutch West Indians | 0.0 /100 | #306 | Tragic $46,656 |
| Immigrants | Dominican Republic | 0.0 /100 | #307 | Tragic $46,655 |
| Ottawa | 0.0 /100 | #308 | Tragic $46,611 |
| Creek | 0.0 /100 | #309 | Tragic $46,594 |
| Cubans | 0.0 /100 | #310 | Tragic $46,580 |
| Apache | 0.0 /100 | #311 | Tragic $46,429 |
| Hispanics or Latinos | 0.0 /100 | #312 | Tragic $46,419 |