Ethiopian vs Samoan Median Household Income
COMPARE
Ethiopian
Samoan
Median Household Income
Median Household Income Comparison
Ethiopians
Samoans
$89,640
MEDIAN HOUSEHOLD INCOME
94.9/ 100
METRIC RATING
121st/ 347
METRIC RANK
$86,498
MEDIAN HOUSEHOLD INCOME
71.0/ 100
METRIC RATING
157th/ 347
METRIC RANK
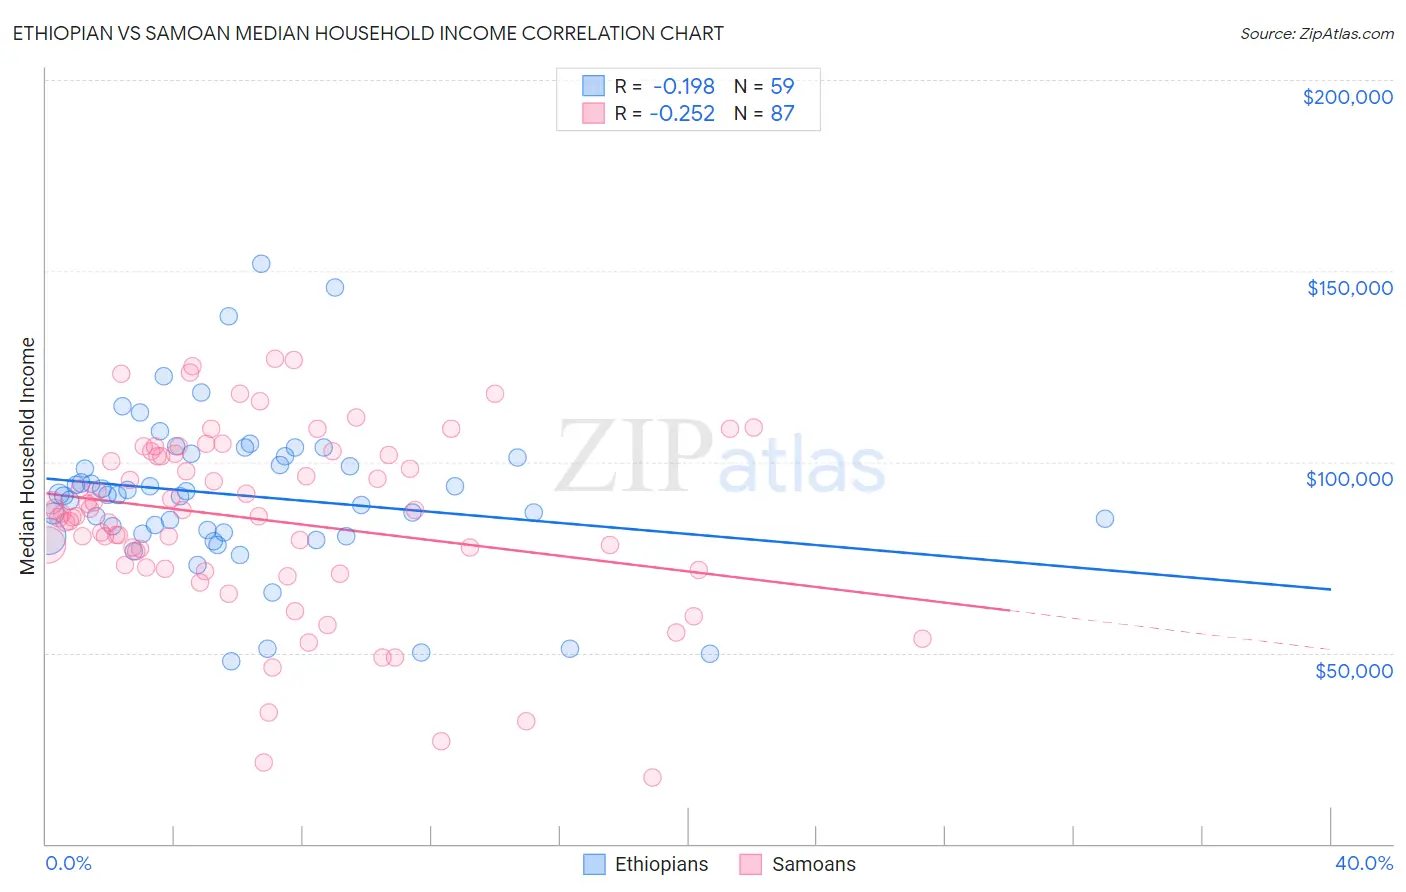
Ethiopian vs Samoan Median Household Income Correlation Chart
The statistical analysis conducted on geographies consisting of 223,045,474 people shows a poor negative correlation between the proportion of Ethiopians and median household income in the United States with a correlation coefficient (R) of -0.198 and weighted average of $89,640. Similarly, the statistical analysis conducted on geographies consisting of 225,063,012 people shows a weak negative correlation between the proportion of Samoans and median household income in the United States with a correlation coefficient (R) of -0.252 and weighted average of $86,498, a difference of 3.6%.
Median Household Income Correlation Summary
| Measurement | Ethiopian | Samoan |
| Minimum | $47,668 | $17,452 |
| Maximum | $151,943 | $127,143 |
| Range | $104,275 | $109,691 |
| Mean | $91,215 | $84,959 |
| Median | $91,248 | $86,491 |
| Interquartile 25% (IQ1) | $81,124 | $72,428 |
| Interquartile 75% (IQ3) | $101,374 | $101,996 |
| Interquartile Range (IQR) | $20,250 | $29,568 |
| Standard Deviation (Sample) | $20,515 | $23,715 |
| Standard Deviation (Population) | $20,340 | $23,578 |
Similar Demographics by Median Household Income
Demographics Similar to Ethiopians by Median Household Income
In terms of median household income, the demographic groups most similar to Ethiopians are Pakistani ($89,638, a difference of 0.0%), Immigrants from North Macedonia ($89,741, a difference of 0.11%), Albanian ($89,744, a difference of 0.12%), Immigrants from Zimbabwe ($89,496, a difference of 0.16%), and Syrian ($89,830, a difference of 0.21%).
| Demographics | Rating | Rank | Median Household Income |
| Immigrants | Northern Africa | 95.9 /100 | #114 | Exceptional $90,026 |
| Immigrants | Western Asia | 95.9 /100 | #115 | Exceptional $90,005 |
| Native Hawaiians | 95.7 /100 | #116 | Exceptional $89,919 |
| Taiwanese | 95.6 /100 | #117 | Exceptional $89,900 |
| Syrians | 95.4 /100 | #118 | Exceptional $89,830 |
| Albanians | 95.2 /100 | #119 | Exceptional $89,744 |
| Immigrants | North Macedonia | 95.2 /100 | #120 | Exceptional $89,741 |
| Ethiopians | 94.9 /100 | #121 | Exceptional $89,640 |
| Pakistanis | 94.8 /100 | #122 | Exceptional $89,638 |
| Immigrants | Zimbabwe | 94.4 /100 | #123 | Exceptional $89,496 |
| Immigrants | Jordan | 94.1 /100 | #124 | Exceptional $89,412 |
| Immigrants | Kuwait | 93.5 /100 | #125 | Exceptional $89,263 |
| Immigrants | Oceania | 92.9 /100 | #126 | Exceptional $89,100 |
| Immigrants | Peru | 92.5 /100 | #127 | Exceptional $89,010 |
| Portuguese | 92.3 /100 | #128 | Exceptional $88,976 |
Demographics Similar to Samoans by Median Household Income
In terms of median household income, the demographic groups most similar to Samoans are Immigrants from Albania ($86,534, a difference of 0.040%), Moroccan ($86,468, a difference of 0.040%), Immigrants from Uzbekistan ($86,425, a difference of 0.080%), Luxembourger ($86,418, a difference of 0.090%), and Slavic ($86,398, a difference of 0.12%).
| Demographics | Rating | Rank | Median Household Income |
| Basques | 77.2 /100 | #150 | Good $87,001 |
| Hungarians | 76.3 /100 | #151 | Good $86,920 |
| Immigrants | Saudi Arabia | 75.8 /100 | #152 | Good $86,875 |
| South Americans | 75.1 /100 | #153 | Good $86,824 |
| Immigrants | Germany | 74.4 /100 | #154 | Good $86,764 |
| Carpatho Rusyns | 72.8 /100 | #155 | Good $86,635 |
| Immigrants | Albania | 71.5 /100 | #156 | Good $86,534 |
| Samoans | 71.0 /100 | #157 | Good $86,498 |
| Moroccans | 70.6 /100 | #158 | Good $86,468 |
| Immigrants | Uzbekistan | 70.1 /100 | #159 | Good $86,425 |
| Luxembourgers | 70.0 /100 | #160 | Good $86,418 |
| Slavs | 69.7 /100 | #161 | Good $86,398 |
| Guamanians/Chamorros | 67.7 /100 | #162 | Good $86,255 |
| Czechs | 66.4 /100 | #163 | Good $86,164 |
| Irish | 66.2 /100 | #164 | Good $86,145 |