Estonian vs Nonimmigrants Median Female Earnings
COMPARE
Estonian
Nonimmigrants
Median Female Earnings
Median Female Earnings Comparison
Estonians
Nonimmigrants
$43,106
MEDIAN FEMALE EARNINGS
99.9/ 100
METRIC RATING
59th/ 347
METRIC RANK
$37,024
MEDIAN FEMALE EARNINGS
0.4/ 100
METRIC RATING
267th/ 347
METRIC RANK
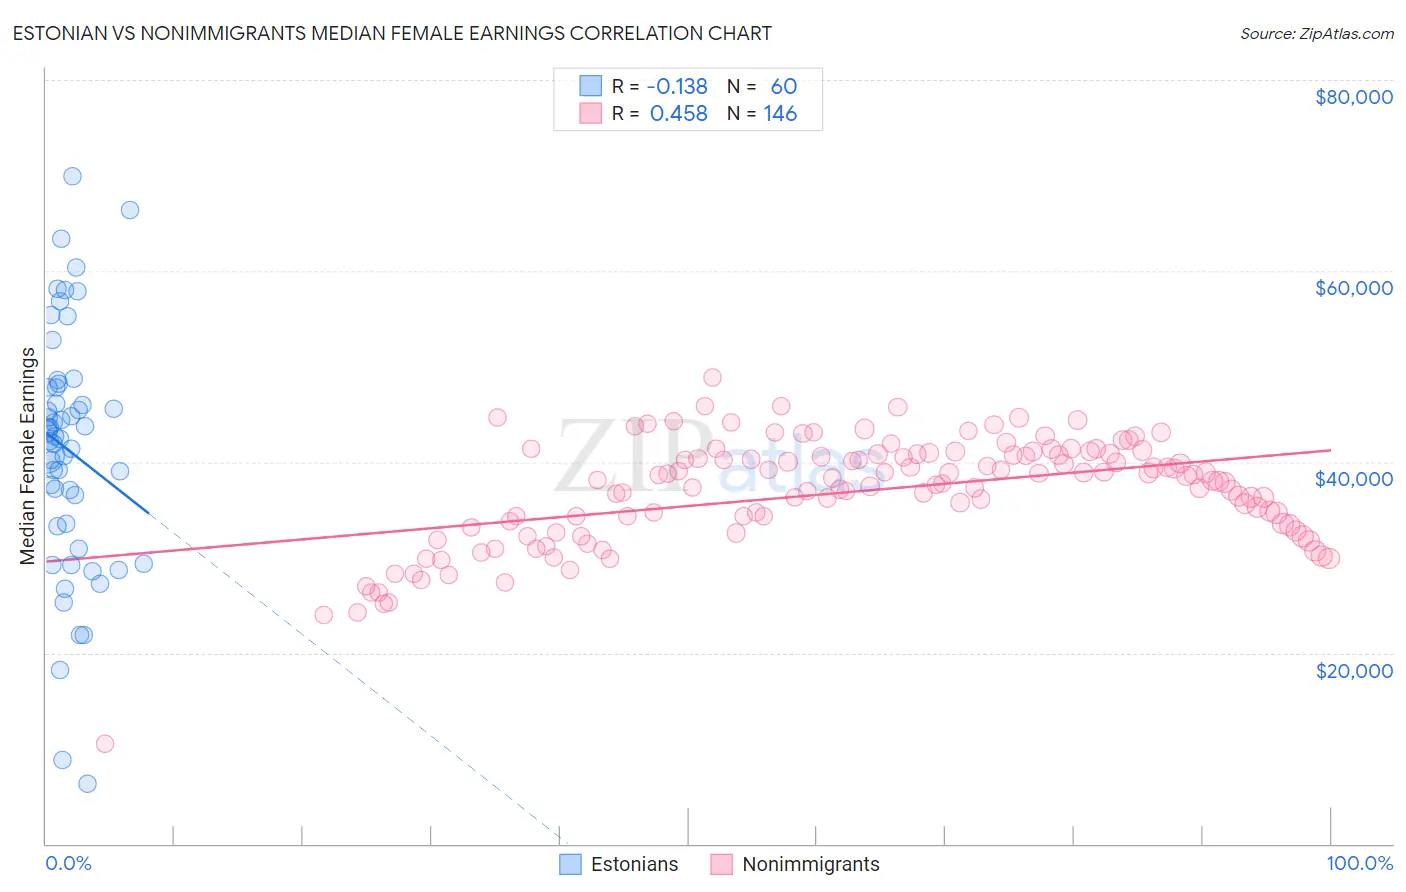
Estonian vs Nonimmigrants Median Female Earnings Correlation Chart
The statistical analysis conducted on geographies consisting of 123,507,211 people shows a poor negative correlation between the proportion of Estonians and median female earnings in the United States with a correlation coefficient (R) of -0.138 and weighted average of $43,106. Similarly, the statistical analysis conducted on geographies consisting of 581,449,824 people shows a moderate positive correlation between the proportion of Nonimmigrants and median female earnings in the United States with a correlation coefficient (R) of 0.458 and weighted average of $37,024, a difference of 16.4%.
Median Female Earnings Correlation Summary
| Measurement | Estonian | Nonimmigrants |
| Minimum | $6,250 | $10,532 |
| Maximum | $69,908 | $48,847 |
| Range | $63,658 | $38,315 |
| Mean | $41,197 | $36,884 |
| Median | $42,543 | $38,067 |
| Interquartile 25% (IQ1) | $33,356 | $33,375 |
| Interquartile 75% (IQ3) | $47,750 | $40,787 |
| Interquartile Range (IQR) | $14,393 | $7,412 |
| Standard Deviation (Sample) | $12,774 | $5,653 |
| Standard Deviation (Population) | $12,667 | $5,634 |
Similar Demographics by Median Female Earnings
Demographics Similar to Estonians by Median Female Earnings
In terms of median female earnings, the demographic groups most similar to Estonians are Immigrants from Latvia ($43,099, a difference of 0.020%), Immigrants from Bulgaria ($43,085, a difference of 0.050%), Afghan ($43,077, a difference of 0.070%), Immigrants from Ukraine ($43,069, a difference of 0.090%), and Immigrants from Pakistan ($43,052, a difference of 0.12%).
| Demographics | Rating | Rank | Median Female Earnings |
| Immigrants | Lithuania | 99.9 /100 | #52 | Exceptional $43,317 |
| Immigrants | Eastern Europe | 99.9 /100 | #53 | Exceptional $43,309 |
| Australians | 99.9 /100 | #54 | Exceptional $43,308 |
| Egyptians | 99.9 /100 | #55 | Exceptional $43,305 |
| Immigrants | Croatia | 99.9 /100 | #56 | Exceptional $43,258 |
| Ethiopians | 99.9 /100 | #57 | Exceptional $43,243 |
| Paraguayans | 99.9 /100 | #58 | Exceptional $43,173 |
| Estonians | 99.9 /100 | #59 | Exceptional $43,106 |
| Immigrants | Latvia | 99.9 /100 | #60 | Exceptional $43,099 |
| Immigrants | Bulgaria | 99.9 /100 | #61 | Exceptional $43,085 |
| Afghans | 99.9 /100 | #62 | Exceptional $43,077 |
| Immigrants | Ukraine | 99.9 /100 | #63 | Exceptional $43,069 |
| Immigrants | Pakistan | 99.9 /100 | #64 | Exceptional $43,052 |
| Sierra Leoneans | 99.9 /100 | #65 | Exceptional $42,868 |
| Immigrants | Norway | 99.9 /100 | #66 | Exceptional $42,837 |
Demographics Similar to Nonimmigrants by Median Female Earnings
In terms of median female earnings, the demographic groups most similar to Nonimmigrants are Cree ($37,018, a difference of 0.010%), Dominican ($37,046, a difference of 0.060%), Immigrants from Venezuela ($37,003, a difference of 0.060%), Immigrants from Belize ($37,056, a difference of 0.090%), and Salvadoran ($37,083, a difference of 0.16%).
| Demographics | Rating | Rank | Median Female Earnings |
| Dutch | 0.7 /100 | #260 | Tragic $37,339 |
| Malaysians | 0.7 /100 | #261 | Tragic $37,298 |
| Venezuelans | 0.7 /100 | #262 | Tragic $37,282 |
| German Russians | 0.5 /100 | #263 | Tragic $37,105 |
| Salvadorans | 0.4 /100 | #264 | Tragic $37,083 |
| Immigrants | Belize | 0.4 /100 | #265 | Tragic $37,056 |
| Dominicans | 0.4 /100 | #266 | Tragic $37,046 |
| Immigrants | Nonimmigrants | 0.4 /100 | #267 | Tragic $37,024 |
| Cree | 0.4 /100 | #268 | Tragic $37,018 |
| Immigrants | Venezuela | 0.4 /100 | #269 | Tragic $37,003 |
| French American Indians | 0.3 /100 | #270 | Tragic $36,920 |
| Nicaraguans | 0.3 /100 | #271 | Tragic $36,904 |
| Immigrants | Dominican Republic | 0.3 /100 | #272 | Tragic $36,857 |
| Immigrants | Laos | 0.3 /100 | #273 | Tragic $36,841 |
| Immigrants | El Salvador | 0.2 /100 | #274 | Tragic $36,673 |