Estonian vs Inupiat Householder Income Over 65 years
COMPARE
Estonian
Inupiat
Householder Income Over 65 years
Householder Income Over 65 years Comparison
Estonians
Inupiat
$67,926
HOUSEHOLDER INCOME OVER 65 YEARS
99.9/ 100
METRIC RATING
38th/ 347
METRIC RANK
$61,061
HOUSEHOLDER INCOME OVER 65 YEARS
52.4/ 100
METRIC RATING
171st/ 347
METRIC RANK
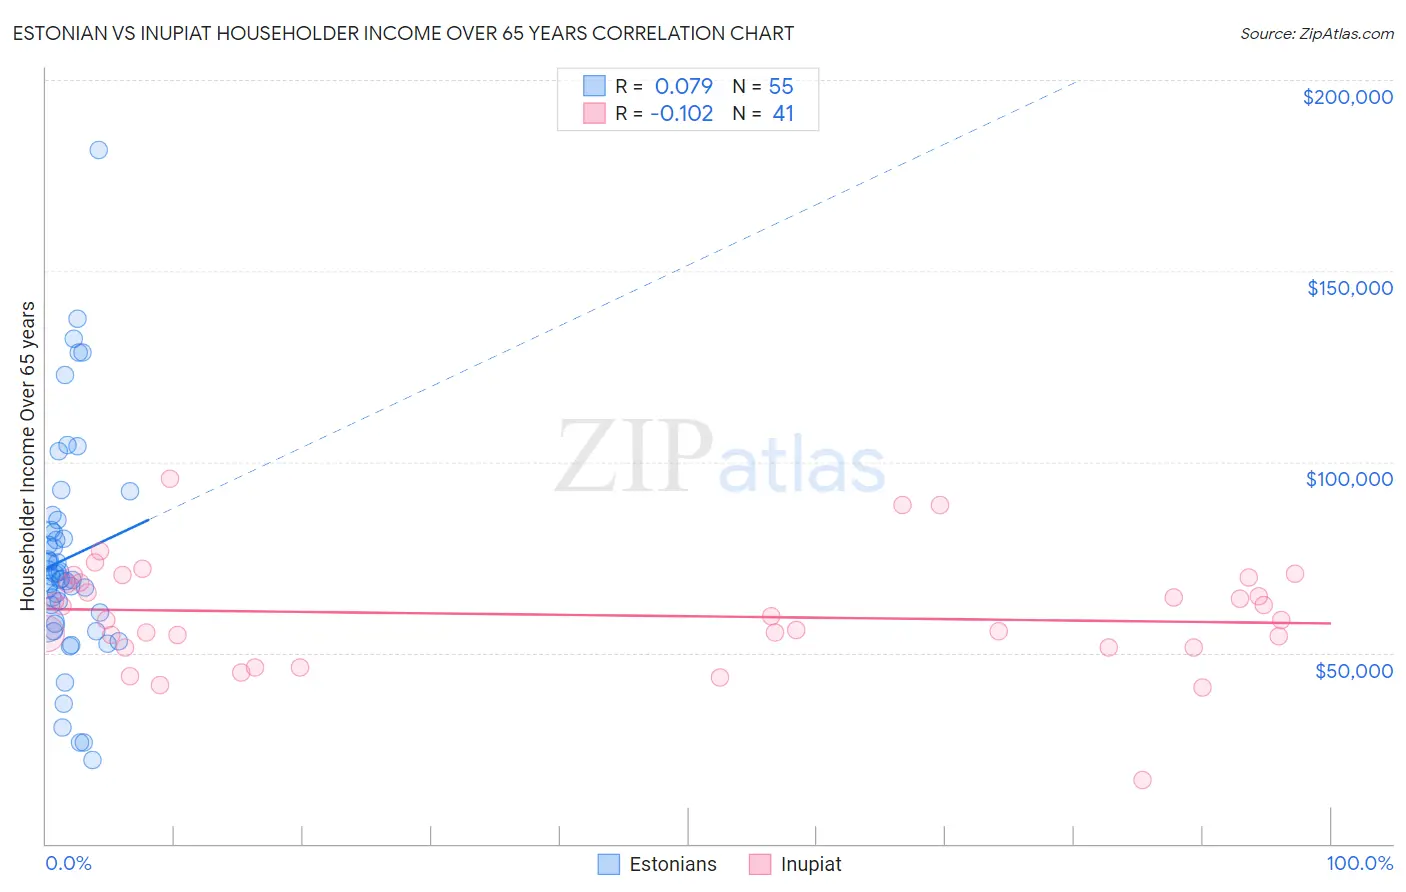
Estonian vs Inupiat Householder Income Over 65 years Correlation Chart
The statistical analysis conducted on geographies consisting of 123,423,480 people shows a slight positive correlation between the proportion of Estonians and household income with householder over the age of 65 in the United States with a correlation coefficient (R) of 0.079 and weighted average of $67,926. Similarly, the statistical analysis conducted on geographies consisting of 96,206,206 people shows a poor negative correlation between the proportion of Inupiat and household income with householder over the age of 65 in the United States with a correlation coefficient (R) of -0.102 and weighted average of $61,061, a difference of 11.2%.
Householder Income Over 65 years Correlation Summary
| Measurement | Estonian | Inupiat |
| Minimum | $21,786 | $16,607 |
| Maximum | $181,719 | $95,647 |
| Range | $159,933 | $79,040 |
| Mean | $74,728 | $59,905 |
| Median | $70,115 | $58,687 |
| Interquartile 25% (IQ1) | $57,743 | $51,307 |
| Interquartile 75% (IQ3) | $82,145 | $69,101 |
| Interquartile Range (IQR) | $24,401 | $17,794 |
| Standard Deviation (Sample) | $29,421 | $14,461 |
| Standard Deviation (Population) | $29,152 | $14,284 |
Similar Demographics by Householder Income Over 65 years
Demographics Similar to Estonians by Householder Income Over 65 years
In terms of householder income over 65 years, the demographic groups most similar to Estonians are Turkish ($68,037, a difference of 0.16%), Immigrants from Austria ($68,208, a difference of 0.42%), Russian ($67,626, a difference of 0.44%), Tongan ($68,235, a difference of 0.46%), and Immigrants from Asia ($67,594, a difference of 0.49%).
| Demographics | Rating | Rank | Householder Income Over 65 years |
| Afghans | 100.0 /100 | #31 | Exceptional $68,951 |
| Asians | 100.0 /100 | #32 | Exceptional $68,822 |
| Immigrants | Denmark | 100.0 /100 | #33 | Exceptional $68,801 |
| Immigrants | Ireland | 100.0 /100 | #34 | Exceptional $68,495 |
| Tongans | 100.0 /100 | #35 | Exceptional $68,235 |
| Immigrants | Austria | 99.9 /100 | #36 | Exceptional $68,208 |
| Turks | 99.9 /100 | #37 | Exceptional $68,037 |
| Estonians | 99.9 /100 | #38 | Exceptional $67,926 |
| Russians | 99.9 /100 | #39 | Exceptional $67,626 |
| Immigrants | Asia | 99.9 /100 | #40 | Exceptional $67,594 |
| Koreans | 99.9 /100 | #41 | Exceptional $67,472 |
| New Zealanders | 99.9 /100 | #42 | Exceptional $67,333 |
| Latvians | 99.9 /100 | #43 | Exceptional $67,326 |
| Immigrants | South Africa | 99.9 /100 | #44 | Exceptional $67,234 |
| Immigrants | Afghanistan | 99.8 /100 | #45 | Exceptional $67,007 |
Demographics Similar to Inupiat by Householder Income Over 65 years
In terms of householder income over 65 years, the demographic groups most similar to Inupiat are Immigrants from Poland ($61,041, a difference of 0.030%), Serbian ($61,087, a difference of 0.040%), Carpatho Rusyn ($61,093, a difference of 0.050%), Irish ($61,097, a difference of 0.060%), and Norwegian ($61,104, a difference of 0.070%).
| Demographics | Rating | Rank | Householder Income Over 65 years |
| Immigrants | North Macedonia | 55.4 /100 | #164 | Average $61,175 |
| Immigrants | Ukraine | 55.1 /100 | #165 | Average $61,163 |
| Immigrants | Eastern Africa | 55.0 /100 | #166 | Average $61,157 |
| Norwegians | 53.6 /100 | #167 | Average $61,104 |
| Irish | 53.4 /100 | #168 | Average $61,097 |
| Carpatho Rusyns | 53.3 /100 | #169 | Average $61,093 |
| Serbians | 53.1 /100 | #170 | Average $61,087 |
| Inupiat | 52.4 /100 | #171 | Average $61,061 |
| Immigrants | Poland | 51.9 /100 | #172 | Average $61,041 |
| Immigrants | Micronesia | 50.8 /100 | #173 | Average $61,000 |
| Luxembourgers | 50.0 /100 | #174 | Average $60,967 |
| Spaniards | 47.3 /100 | #175 | Average $60,866 |
| Spanish | 45.5 /100 | #176 | Average $60,795 |
| Alaska Natives | 44.3 /100 | #177 | Average $60,748 |
| Yup'ik | 43.7 /100 | #178 | Average $60,727 |