Estonian vs Czechoslovakian Householder Income Under 25 years

COMPARE

Estonian
Race
Ancestry
AfghanAfricanAlaska NativeAlaskan AthabascanAlbanianAleutAlsatianAmericanApacheArabArapahoArgentineanArmenianAssyrian/Chaldean/SyriacAustralianAustrianBahamianBangladeshiBarbadianBasqueBelgianBelizeanBermudanBhutaneseBlackfeetBolivianBrazilianBritishBritish West IndianBulgarianBurmeseCajunCambodianCanadianCape VerdeanCarpatho RusynCelticCentral AmericanCentral American IndianCherokeeCheyenneChickasawChileanChineseChippewaChoctawColombianColvilleComancheCosta RicanCreeCreekCroatianCrowCubanCypriotCzechDanishDelawareDominicanDutchDutch West IndianEastern EuropeanEcuadorianEgyptianEnglishEstonianEthiopianEuropeanFijianFilipinoFinnishFrenchFrench American IndianFrench CanadianGermanGerman RussianGhanaianGreekGuamanian/ChamorroGuatemalanGuyaneseHaitianHmongHonduranHopiHoumaHungarianIcelanderIndian (Asian)IndonesianInupiatIranianIraqiIrishIroquoisIsraeliItalianJamaicanJapaneseJordanianKenyanKiowaKoreanLaotianLatvianLebaneseLiberianLithuanianLumbeeLuxembourgerMacedonianMalaysianMalteseMarshalleseMenomineeMexicanMexican American IndianMongolianMoroccanNative HawaiianNavajoNepaleseNew ZealanderNicaraguanNigerianNorthern EuropeanNorwegianOkinawanOsageOttawaPaiutePakistaniPalestinianPanamanianParaguayanPennsylvania GermanPeruvianPimaPolishPortuguesePotawatomiPuebloPuerto RicanPuget Sound SalishRomanianRussianSalvadoranSamoanScandinavianScotch-IrishScottishSeminoleSenegaleseSerbianShoshoneSierra LeoneanSiouxSlavicSlovakSloveneSomaliSouth AfricanSouth AmericanSouth American IndianSoviet UnionSpaniardSpanishSpanish AmericanSpanish American IndianSri LankanSubsaharan AfricanSudaneseSwedishSwissSyrianTaiwaneseThaiTlingit-HaidaTohono O'OdhamTonganTrinidadian and TobagonianTsimshianTurkishU.S. Virgin IslanderUgandanUkrainianUruguayanUteVenezuelanVietnameseWelshWest IndianYakamaYaquiYugoslavianYumanYup'ikZimbabwean
Immigration
NonimmigrantsImmigrantsAfghanistanAfricaAlbaniaArgentinaArmeniaAsiaAustraliaAustriaBahamasBangladeshBarbadosBelarusBelgiumBelizeBoliviaBosnia and HerzegovinaBrazilBulgariaBurma/MyanmarCabo VerdeCambodiaCameroonCanadaCaribbeanCentral AmericaChileChinaColombiaCongoCosta RicaCroatiaCubaCzechoslovakiaDenmarkDominicaDominican RepublicEastern AfricaEastern AsiaEastern EuropeEcuadorEgyptEl SalvadorEnglandEritreaEthiopiaEuropeFijiFranceGermanyGhanaGreeceGrenadaGuatemalaGuyanaHaitiHondurasHong KongHungaryIndiaIndonesiaIranIraqIrelandIsraelItalyJamaicaJapanJordanKazakhstanKenyaKoreaKuwaitLaosLatin AmericaLatviaLebanonLiberiaLithuaniaMalaysiaMexicoMicronesiaMiddle AfricaMoldovaMoroccoNepalNetherlandsNicaraguaNigeriaNorth AmericaNorth MacedoniaNorthern AfricaNorthern EuropeNorwayOceaniaPakistanPanamaPeruPhilippinesPolandPortugalRomaniaRussiaSaudi ArabiaScotlandSenegalSerbiaSierra LeoneSingaporeSomaliaSouth AfricaSouth AmericaSouth Central AsiaSouth Eastern AsiaSouthern EuropeSpainSri LankaSt. Vincent and the GrenadinesSudanSwedenSwitzerlandSyriaTaiwanThailandTrinidad and TobagoTurkeyUgandaUkraineUruguayUzbekistanVenezuelaVietnamWest IndiesWestern AfricaWestern AsiaWestern EuropeYemenZaireZimbabweAzores
Czechoslovakian
Race
Ancestry
AfghanAfricanAlaska NativeAlaskan AthabascanAlbanianAleutAlsatianAmericanApacheArabArapahoArgentineanArmenianAssyrian/Chaldean/SyriacAustralianAustrianBahamianBangladeshiBarbadianBasqueBelgianBelizeanBermudanBhutaneseBlackfeetBolivianBrazilianBritishBritish West IndianBulgarianBurmeseCajunCambodianCanadianCape VerdeanCarpatho RusynCelticCentral AmericanCentral American IndianCherokeeCheyenneChickasawChileanChineseChippewaChoctawColombianColvilleComancheCosta RicanCreeCreekCroatianCrowCubanCypriotCzechCzechoslovakianDanishDelawareDominicanDutchDutch West IndianEastern EuropeanEcuadorianEgyptianEnglishEthiopianEuropeanFijianFilipinoFinnishFrenchFrench American IndianFrench CanadianGermanGerman RussianGhanaianGreekGuamanian/ChamorroGuatemalanGuyaneseHaitianHmongHonduranHopiHoumaHungarianIcelanderIndian (Asian)IndonesianInupiatIranianIraqiIrishIroquoisIsraeliItalianJamaicanJapaneseJordanianKenyanKiowaKoreanLaotianLatvianLebaneseLiberianLithuanianLumbeeLuxembourgerMacedonianMalaysianMalteseMarshalleseMenomineeMexicanMexican American IndianMongolianMoroccanNative HawaiianNavajoNepaleseNew ZealanderNicaraguanNigerianNorthern EuropeanNorwegianOkinawanOsageOttawaPaiutePakistaniPalestinianPanamanianParaguayanPennsylvania GermanPeruvianPimaPolishPortuguesePotawatomiPuebloPuerto RicanPuget Sound SalishRomanianRussianSalvadoranSamoanScandinavianScotch-IrishScottishSeminoleSenegaleseSerbianShoshoneSierra LeoneanSiouxSlavicSlovakSloveneSomaliSouth AfricanSouth AmericanSouth American IndianSoviet UnionSpaniardSpanishSpanish AmericanSpanish American IndianSri LankanSubsaharan AfricanSudaneseSwedishSwissSyrianTaiwaneseThaiTlingit-HaidaTohono O'OdhamTonganTrinidadian and TobagonianTsimshianTurkishU.S. Virgin IslanderUgandanUkrainianUruguayanUteVenezuelanVietnameseWelshWest IndianYakamaYaquiYugoslavianYumanYup'ikZimbabwean
Immigration
NonimmigrantsImmigrantsAfghanistanAfricaAlbaniaArgentinaArmeniaAsiaAustraliaAustriaBahamasBangladeshBarbadosBelarusBelgiumBelizeBoliviaBosnia and HerzegovinaBrazilBulgariaBurma/MyanmarCabo VerdeCambodiaCameroonCanadaCaribbeanCentral AmericaChileChinaColombiaCongoCosta RicaCroatiaCubaCzechoslovakiaDenmarkDominicaDominican RepublicEastern AfricaEastern AsiaEastern EuropeEcuadorEgyptEl SalvadorEnglandEritreaEthiopiaEuropeFijiFranceGermanyGhanaGreeceGrenadaGuatemalaGuyanaHaitiHondurasHong KongHungaryIndiaIndonesiaIranIraqIrelandIsraelItalyJamaicaJapanJordanKazakhstanKenyaKoreaKuwaitLaosLatin AmericaLatviaLebanonLiberiaLithuaniaMalaysiaMexicoMicronesiaMiddle AfricaMoldovaMoroccoNepalNetherlandsNicaraguaNigeriaNorth AmericaNorth MacedoniaNorthern AfricaNorthern EuropeNorwayOceaniaPakistanPanamaPeruPhilippinesPolandPortugalRomaniaRussiaSaudi ArabiaScotlandSenegalSerbiaSierra LeoneSingaporeSomaliaSouth AfricaSouth AmericaSouth Central AsiaSouth Eastern AsiaSouthern EuropeSpainSri LankaSt. Vincent and the GrenadinesSudanSwedenSwitzerlandSyriaTaiwanThailandTrinidad and TobagoTurkeyUgandaUkraineUruguayUzbekistanVenezuelaVietnamWest IndiesWestern AfricaWestern AsiaWestern EuropeYemenZaireZimbabweAzores
Householder Income Under 25 years
Income
Poverty
Unemployment
Labor Participation
Family Structure
Vehicle Availability
Education Level
Disability

Householder Income Under 25 years Comparison

Estonians

Czechoslovakians

Poor
Tragic
$51,523
HOUSEHOLDER INCOME UNDER 25 YEARS
16.4/ 100
METRIC RATING
195th/ 347
METRIC RANK
$51,224
HOUSEHOLDER INCOME UNDER 25 YEARS
8.6/ 100
METRIC RATING
217th/ 347
METRIC RANK

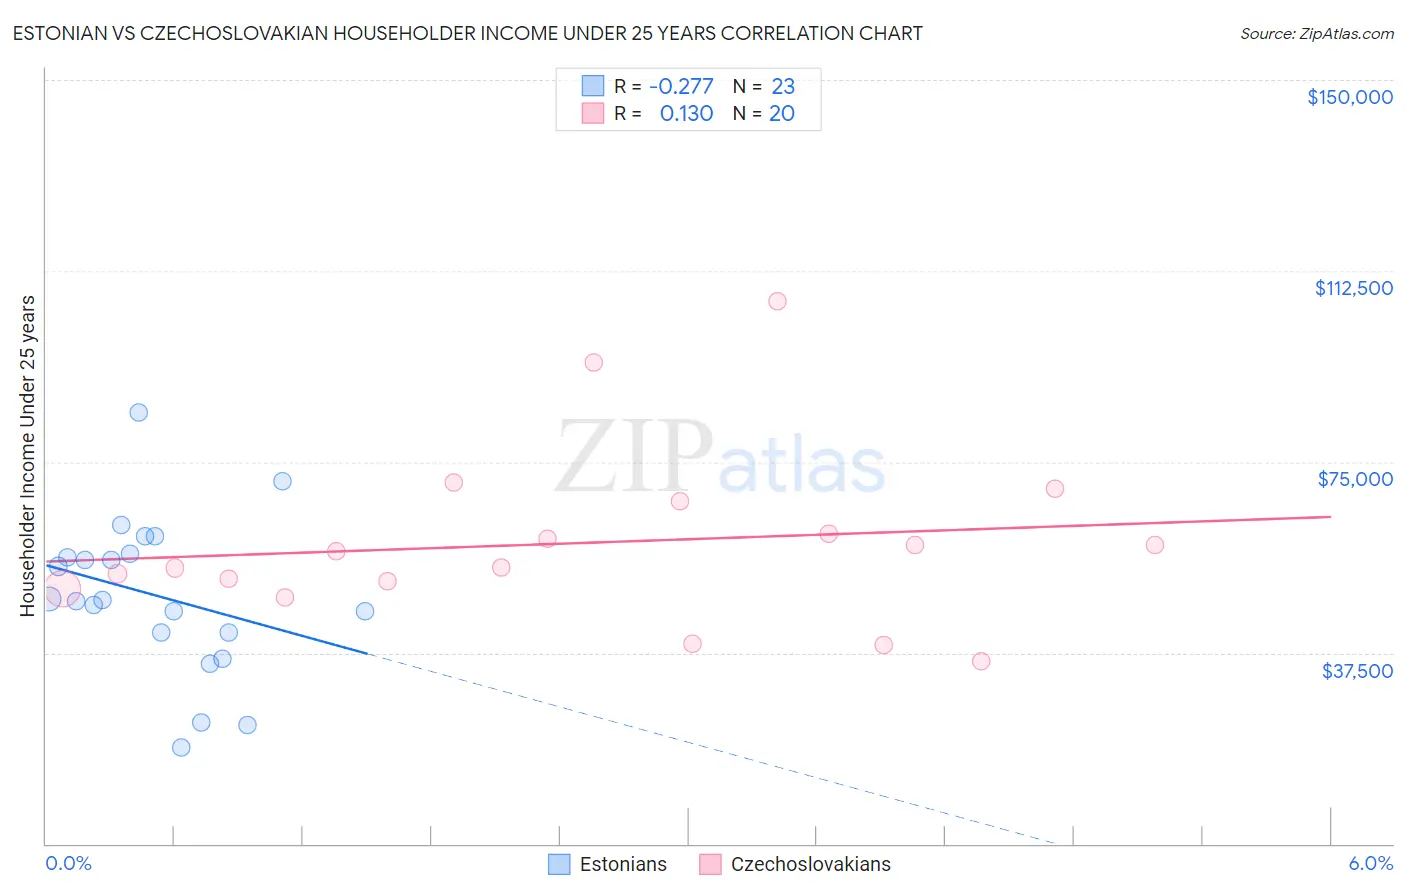
Estonian vs Czechoslovakian Householder Income Under 25 years Correlation Chart

The statistical analysis conducted on geographies consisting of 111,851,502 people shows a weak negative correlation between the proportion of Estonians and household income with householder under the age of 25 in the United States with a correlation coefficient (R) of -0.277 and weighted average of $51,523. Similarly, the statistical analysis conducted on geographies consisting of 311,218,514 people shows a poor positive correlation between the proportion of Czechoslovakians and household income with householder under the age of 25 in the United States with a correlation coefficient (R) of 0.130 and weighted average of $51,224, a difference of 0.58%.
Estonian vs Czechoslovakian Householder Income Under 25 years

Householder Income Under 25 years Correlation Summary

MeasurementEstonianCzechoslovakian
Minimum$18,790$35,781
Maximum$84,706$106,448
Range$65,916$70,667
Mean$48,704$59,100
Median$47,907$55,865
Interquartile 25% (IQ1)$41,381$50,876
Interquartile 75% (IQ3)$56,834$64,106
Interquartile Range (IQR)$15,453$13,231
Standard Deviation (Sample)$15,301$17,072
Standard Deviation (Population)$14,964$16,639

Similar Demographics by Householder Income Under 25 years

Demographics Similar to Estonians by Householder Income Under 25 years

In terms of householder income under 25 years, the demographic groups most similar to Estonians are Guatemalan ($51,525, a difference of 0.0%), Palestinian ($51,515, a difference of 0.020%), Pima ($51,503, a difference of 0.040%), Immigrants from Syria ($51,494, a difference of 0.060%), and Swiss ($51,493, a difference of 0.060%).
DemographicsRating | RankHouseholder Income Under 25 years
Northern Europeans
22.2
/100
|
#188
Fair
$51,678
Croatians
21.6
/100
|
#189
Fair
$51,662
Malaysians
19.7
/100
|
#190
Poor
$51,615
Panamanians
19.5
/100
|
#191
Poor
$51,611
West Indians
18.5
/100
|
#192
Poor
$51,583
Immigrants | Eritrea
18.1
/100
|
#193
Poor
$51,574
Guatemalans
16.4
/100
|
#194
Poor
$51,525
Estonians
16.4
/100
|
#195
Poor
$51,523
Palestinians
16.1
/100
|
#196
Poor
$51,515
Pima
15.7
/100
|
#197
Poor
$51,503
Immigrants | Syria
15.4
/100
|
#198
Poor
$51,494
Swiss
15.4
/100
|
#199
Poor
$51,493
Immigrants | West Indies
14.9
/100
|
#200
Poor
$51,479
British
14.9
/100
|
#201
Poor
$51,477
Immigrants | Guatemala
14.0
/100
|
#202
Poor
$51,447

Demographics Similar to Czechoslovakians by Householder Income Under 25 years

In terms of householder income under 25 years, the demographic groups most similar to Czechoslovakians are Immigrants from Belize ($51,223, a difference of 0.0%), French ($51,230, a difference of 0.010%), Arab ($51,219, a difference of 0.010%), Icelander ($51,247, a difference of 0.050%), and Zimbabwean ($51,259, a difference of 0.070%).
DemographicsRating | RankHouseholder Income Under 25 years
Immigrants | Ghana
10.9
/100
|
#210
Poor
$51,333
Irish
10.6
/100
|
#211
Poor
$51,317
Immigrants | Panama
9.7
/100
|
#212
Tragic
$51,278
Dutch
9.4
/100
|
#213
Tragic
$51,265
Zimbabweans
9.3
/100
|
#214
Tragic
$51,259
Icelanders
9.1
/100
|
#215
Tragic
$51,247
French
8.7
/100
|
#216
Tragic
$51,230
Czechoslovakians
8.6
/100
|
#217
Tragic
$51,224
Immigrants | Belize
8.6
/100
|
#218
Tragic
$51,223
Arabs
8.5
/100
|
#219
Tragic
$51,219
Immigrants | Germany
8.0
/100
|
#220
Tragic
$51,190
Immigrants | Eastern Africa
7.4
/100
|
#221
Tragic
$51,158
Spaniards
6.8
/100
|
#222
Tragic
$51,117
Serbians
6.6
/100
|
#223
Tragic
$51,106
Belizeans
6.4
/100
|
#224
Tragic
$51,094