Egyptian vs Immigrants from Taiwan Per Capita Income

COMPARE

Egyptian
Race
Ancestry
AfghanAfricanAlaska NativeAlaskan AthabascanAlbanianAleutAlsatianAmericanApacheArabArapahoArgentineanArmenianAssyrian/Chaldean/SyriacAustralianAustrianBahamianBangladeshiBarbadianBasqueBelgianBelizeanBermudanBhutaneseBlackfeetBolivianBrazilianBritishBritish West IndianBulgarianBurmeseCajunCambodianCanadianCape VerdeanCarpatho RusynCelticCentral AmericanCentral American IndianCherokeeCheyenneChickasawChileanChineseChippewaChoctawColombianColvilleComancheCosta RicanCreeCreekCroatianCrowCubanCypriotCzechCzechoslovakianDanishDelawareDominicanDutchDutch West IndianEastern EuropeanEcuadorianEgyptianEnglishEstonianEthiopianEuropeanFijianFilipinoFinnishFrenchFrench American IndianFrench CanadianGermanGerman RussianGhanaianGreekGuamanian/ChamorroGuatemalanGuyaneseHaitianHmongHonduranHopiHoumaHungarianIcelanderIndian (Asian)IndonesianInupiatIranianIraqiIrishIroquoisIsraeliItalianJamaicanJapaneseJordanianKenyanKiowaKoreanLaotianLatvianLebaneseLiberianLithuanianLumbeeLuxembourgerMacedonianMalaysianMalteseMarshalleseMenomineeMexicanMexican American IndianMongolianMoroccanNative HawaiianNavajoNepaleseNew ZealanderNicaraguanNigerianNorthern EuropeanNorwegianOkinawanOsageOttawaPaiutePakistaniPalestinianPanamanianParaguayanPennsylvania GermanPeruvianPimaPolishPortuguesePotawatomiPuebloPuerto RicanPuget Sound SalishRomanianRussianSalvadoranSamoanScandinavianScotch-IrishScottishSeminoleSenegaleseSerbianShoshoneSierra LeoneanSiouxSlavicSlovakSloveneSomaliSouth AfricanSouth AmericanSouth American IndianSoviet UnionSpaniardSpanishSpanish AmericanSpanish American IndianSri LankanSubsaharan AfricanSudaneseSwedishSwissSyrianTaiwaneseThaiTlingit-HaidaTohono O'OdhamTonganTrinidadian and TobagonianTsimshianTurkishU.S. Virgin IslanderUgandanUkrainianUruguayanUteVenezuelanVietnameseWelshWest IndianYakamaYaquiYugoslavianYumanYup'ikZimbabwean
Immigration
NonimmigrantsImmigrantsAfghanistanAfricaAlbaniaArgentinaArmeniaAsiaAustraliaAustriaBahamasBangladeshBarbadosBelarusBelgiumBelizeBoliviaBosnia and HerzegovinaBrazilBulgariaBurma/MyanmarCabo VerdeCambodiaCameroonCanadaCaribbeanCentral AmericaChileChinaColombiaCongoCosta RicaCroatiaCubaCzechoslovakiaDenmarkDominicaDominican RepublicEastern AfricaEastern AsiaEastern EuropeEcuadorEgyptEl SalvadorEnglandEritreaEthiopiaEuropeFijiFranceGermanyGhanaGreeceGrenadaGuatemalaGuyanaHaitiHondurasHong KongHungaryIndiaIndonesiaIranIraqIrelandIsraelItalyJamaicaJapanJordanKazakhstanKenyaKoreaKuwaitLaosLatin AmericaLatviaLebanonLiberiaLithuaniaMalaysiaMexicoMicronesiaMiddle AfricaMoldovaMoroccoNepalNetherlandsNicaraguaNigeriaNorth AmericaNorth MacedoniaNorthern AfricaNorthern EuropeNorwayOceaniaPakistanPanamaPeruPhilippinesPolandPortugalRomaniaRussiaSaudi ArabiaScotlandSenegalSerbiaSierra LeoneSingaporeSomaliaSouth AfricaSouth AmericaSouth Central AsiaSouth Eastern AsiaSouthern EuropeSpainSri LankaSt. Vincent and the GrenadinesSudanSwedenSwitzerlandSyriaThailandTrinidad and TobagoTurkeyUgandaUkraineUruguayUzbekistanVenezuelaVietnamWest IndiesWestern AfricaWestern AsiaWestern EuropeYemenZaireZimbabweAzores
Immigrants from Taiwan
Race
Ancestry
AfghanAfricanAlaska NativeAlaskan AthabascanAlbanianAleutAlsatianAmericanApacheArabArapahoArgentineanArmenianAssyrian/Chaldean/SyriacAustralianAustrianBahamianBangladeshiBarbadianBasqueBelgianBelizeanBermudanBhutaneseBlackfeetBolivianBrazilianBritishBritish West IndianBulgarianBurmeseCajunCambodianCanadianCape VerdeanCarpatho RusynCelticCentral AmericanCentral American IndianCherokeeCheyenneChickasawChileanChineseChippewaChoctawColombianColvilleComancheCosta RicanCreeCreekCroatianCrowCubanCypriotCzechCzechoslovakianDanishDelawareDominicanDutchDutch West IndianEastern EuropeanEcuadorianEnglishEstonianEthiopianEuropeanFijianFilipinoFinnishFrenchFrench American IndianFrench CanadianGermanGerman RussianGhanaianGreekGuamanian/ChamorroGuatemalanGuyaneseHaitianHmongHonduranHopiHoumaHungarianIcelanderIndian (Asian)IndonesianInupiatIranianIraqiIrishIroquoisIsraeliItalianJamaicanJapaneseJordanianKenyanKiowaKoreanLaotianLatvianLebaneseLiberianLithuanianLumbeeLuxembourgerMacedonianMalaysianMalteseMarshalleseMenomineeMexicanMexican American IndianMongolianMoroccanNative HawaiianNavajoNepaleseNew ZealanderNicaraguanNigerianNorthern EuropeanNorwegianOkinawanOsageOttawaPaiutePakistaniPalestinianPanamanianParaguayanPennsylvania GermanPeruvianPimaPolishPortuguesePotawatomiPuebloPuerto RicanPuget Sound SalishRomanianRussianSalvadoranSamoanScandinavianScotch-IrishScottishSeminoleSenegaleseSerbianShoshoneSierra LeoneanSiouxSlavicSlovakSloveneSomaliSouth AfricanSouth AmericanSouth American IndianSoviet UnionSpaniardSpanishSpanish AmericanSpanish American IndianSri LankanSubsaharan AfricanSudaneseSwedishSwissSyrianTaiwaneseThaiTlingit-HaidaTohono O'OdhamTonganTrinidadian and TobagonianTsimshianTurkishU.S. Virgin IslanderUgandanUkrainianUruguayanUteVenezuelanVietnameseWelshWest IndianYakamaYaquiYugoslavianYumanYup'ikZimbabwean
Immigration
NonimmigrantsImmigrantsAfghanistanAfricaAlbaniaArgentinaArmeniaAsiaAustraliaAustriaBahamasBangladeshBarbadosBelarusBelgiumBelizeBoliviaBosnia and HerzegovinaBrazilBulgariaBurma/MyanmarCabo VerdeCambodiaCameroonCanadaCaribbeanCentral AmericaChileChinaColombiaCongoCosta RicaCroatiaCubaCzechoslovakiaDenmarkDominicaDominican RepublicEastern AfricaEastern AsiaEastern EuropeEcuadorEgyptEl SalvadorEnglandEritreaEthiopiaEuropeFijiFranceGermanyGhanaGreeceGrenadaGuatemalaGuyanaHaitiHondurasHong KongHungaryIndiaIndonesiaIranIraqIrelandIsraelItalyJamaicaJapanJordanKazakhstanKenyaKoreaKuwaitLaosLatin AmericaLatviaLebanonLiberiaLithuaniaMalaysiaMexicoMicronesiaMiddle AfricaMoldovaMoroccoNepalNetherlandsNicaraguaNigeriaNorth AmericaNorth MacedoniaNorthern AfricaNorthern EuropeNorwayOceaniaPakistanPanamaPeruPhilippinesPolandPortugalRomaniaRussiaSaudi ArabiaScotlandSenegalSerbiaSierra LeoneSingaporeSomaliaSouth AfricaSouth AmericaSouth Central AsiaSouth Eastern AsiaSouthern EuropeSpainSri LankaSt. Vincent and the GrenadinesSudanSwedenSwitzerlandSyriaTaiwanThailandTrinidad and TobagoTurkeyUgandaUkraineUruguayUzbekistanVenezuelaVietnamWest IndiesWestern AfricaWestern AsiaWestern EuropeYemenZaireZimbabweAzores
Per Capita Income
Income
Poverty
Unemployment
Labor Participation
Family Structure
Vehicle Availability
Education Level
Disability

Per Capita Income Comparison

Egyptians

Immigrants from Taiwan

Exceptional
Exceptional
$48,358
PER CAPITA INCOME
99.5/ 100
METRIC RATING
80th/ 347
METRIC RANK
$57,742
PER CAPITA INCOME
100.0/ 100
METRIC RATING
6th/ 347
METRIC RANK

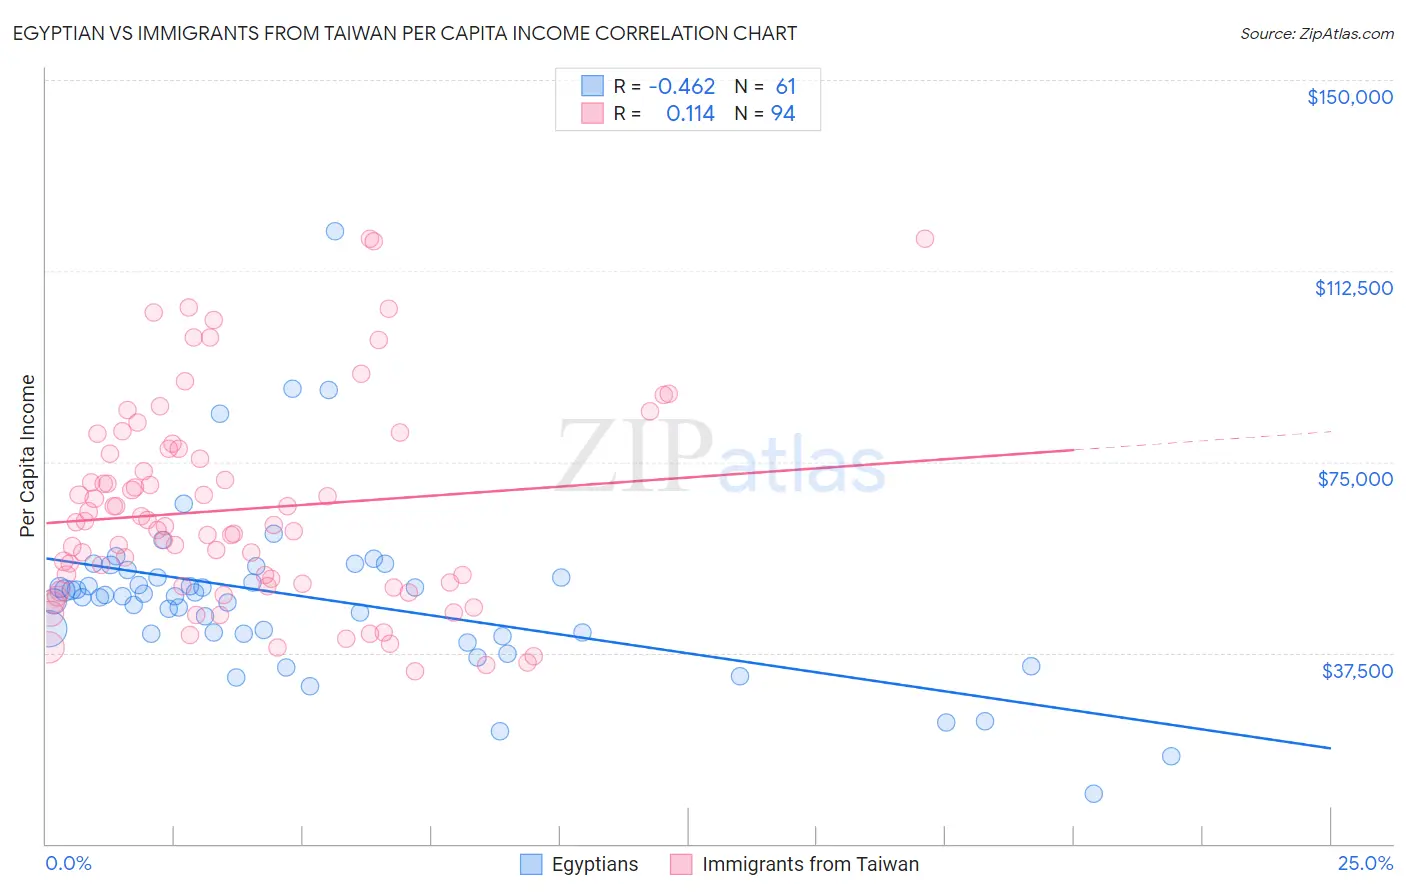
Egyptian vs Immigrants from Taiwan Per Capita Income Correlation Chart

The statistical analysis conducted on geographies consisting of 276,936,692 people shows a moderate negative correlation between the proportion of Egyptians and per capita income in the United States with a correlation coefficient (R) of -0.462 and weighted average of $48,358. Similarly, the statistical analysis conducted on geographies consisting of 298,270,368 people shows a poor positive correlation between the proportion of Immigrants from Taiwan and per capita income in the United States with a correlation coefficient (R) of 0.114 and weighted average of $57,742, a difference of 19.4%.
Egyptian vs Immigrants from Taiwan Per Capita Income

Per Capita Income Correlation Summary

MeasurementEgyptianImmigrants from Taiwan
Minimum$9,805$33,786
Maximum$120,225$118,914
Range$110,420$85,128
Mean$48,391$65,673
Median$48,690$62,475
Interquartile 25% (IQ1)$41,170$50,616
Interquartile 75% (IQ3)$53,076$77,568
Interquartile Range (IQR)$11,906$26,952
Standard Deviation (Sample)$16,881$20,163
Standard Deviation (Population)$16,742$20,056

Similar Demographics by Per Capita Income

Demographics Similar to Egyptians by Per Capita Income

In terms of per capita income, the demographic groups most similar to Egyptians are Armenian ($48,287, a difference of 0.15%), Romanian ($48,445, a difference of 0.18%), Immigrants from Indonesia ($48,195, a difference of 0.34%), Immigrants from Brazil ($48,164, a difference of 0.40%), and Immigrants from Ukraine ($48,134, a difference of 0.46%).
DemographicsRating | RankPer Capita Income
Immigrants | North America
99.8
/100
|
#73
Exceptional
$49,302
Mongolians
99.8
/100
|
#74
Exceptional
$49,173
Immigrants | Bolivia
99.7
/100
|
#75
Exceptional
$48,970
Immigrants | England
99.7
/100
|
#76
Exceptional
$48,844
Immigrants | Kazakhstan
99.7
/100
|
#77
Exceptional
$48,747
Immigrants | Italy
99.6
/100
|
#78
Exceptional
$48,654
Romanians
99.5
/100
|
#79
Exceptional
$48,445
Egyptians
99.5
/100
|
#80
Exceptional
$48,358
Armenians
99.4
/100
|
#81
Exceptional
$48,287
Immigrants | Indonesia
99.4
/100
|
#82
Exceptional
$48,195
Immigrants | Brazil
99.4
/100
|
#83
Exceptional
$48,164
Immigrants | Ukraine
99.3
/100
|
#84
Exceptional
$48,134
Austrians
99.3
/100
|
#85
Exceptional
$48,116
Immigrants | Southern Europe
99.3
/100
|
#86
Exceptional
$48,027
Ukrainians
99.3
/100
|
#87
Exceptional
$48,014

Demographics Similar to Immigrants from Taiwan by Per Capita Income

In terms of per capita income, the demographic groups most similar to Immigrants from Taiwan are Immigrants from Iran ($57,759, a difference of 0.030%), Immigrants from Australia ($57,953, a difference of 0.37%), Immigrants from Israel ($57,384, a difference of 0.62%), Immigrants from Singapore ($58,353, a difference of 1.1%), and Iranian ($58,786, a difference of 1.8%).
DemographicsRating | RankPer Capita Income
Filipinos
100.0
/100
|
#1
Exceptional
$59,066
Iranians
100.0
/100
|
#2
Exceptional
$58,786
Immigrants | Singapore
100.0
/100
|
#3
Exceptional
$58,353
Immigrants | Australia
100.0
/100
|
#4
Exceptional
$57,953
Immigrants | Iran
100.0
/100
|
#5
Exceptional
$57,759
Immigrants | Taiwan
100.0
/100
|
#6
Exceptional
$57,742
Immigrants | Israel
100.0
/100
|
#7
Exceptional
$57,384
Immigrants | Hong Kong
100.0
/100
|
#8
Exceptional
$56,709
Immigrants | Ireland
100.0
/100
|
#9
Exceptional
$56,584
Okinawans
100.0
/100
|
#10
Exceptional
$55,817
Eastern Europeans
100.0
/100
|
#11
Exceptional
$55,780
Immigrants | Sweden
100.0
/100
|
#12
Exceptional
$55,582
Immigrants | India
100.0
/100
|
#13
Exceptional
$55,268
Immigrants | Belgium
100.0
/100
|
#14
Exceptional
$55,082
Cypriots
100.0
/100
|
#15
Exceptional
$54,899