Egyptian vs Immigrants from Croatia Median Male Earnings
COMPARE
Egyptian
Immigrants from Croatia
Median Male Earnings
Median Male Earnings Comparison
Egyptians
Immigrants from Croatia
$61,095
MEDIAN MALE EARNINGS
99.8/ 100
METRIC RATING
60th/ 347
METRIC RANK
$60,914
MEDIAN MALE EARNINGS
99.8/ 100
METRIC RATING
66th/ 347
METRIC RANK
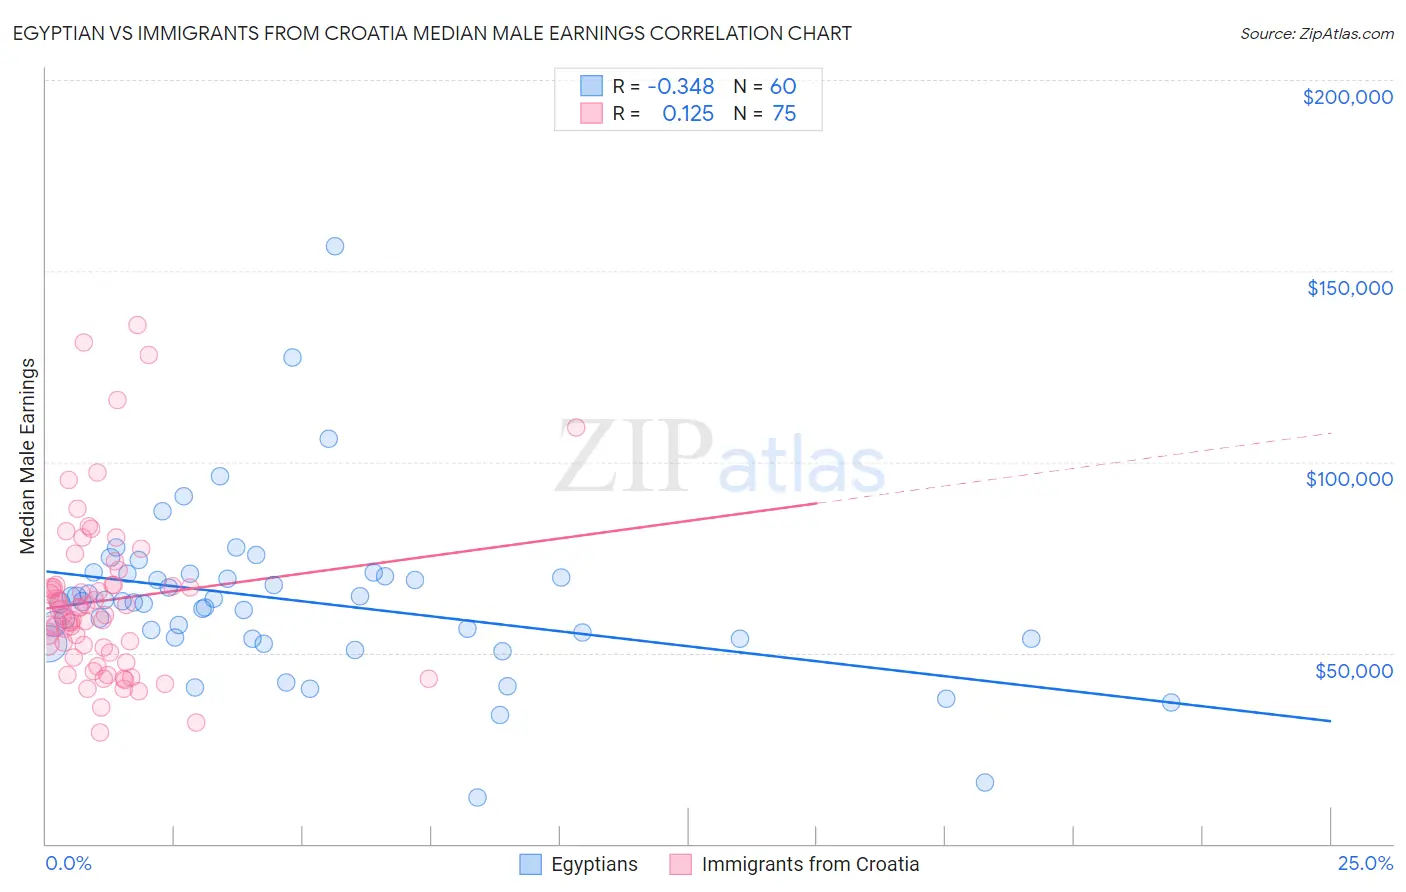
Egyptian vs Immigrants from Croatia Median Male Earnings Correlation Chart
The statistical analysis conducted on geographies consisting of 276,910,194 people shows a mild negative correlation between the proportion of Egyptians and median male earnings in the United States with a correlation coefficient (R) of -0.348 and weighted average of $61,095. Similarly, the statistical analysis conducted on geographies consisting of 132,568,017 people shows a poor positive correlation between the proportion of Immigrants from Croatia and median male earnings in the United States with a correlation coefficient (R) of 0.125 and weighted average of $60,914, a difference of 0.30%.
Median Male Earnings Correlation Summary
| Measurement | Egyptian | Immigrants from Croatia |
| Minimum | $12,000 | $29,220 |
| Maximum | $156,307 | $135,716 |
| Range | $144,307 | $106,496 |
| Mean | $63,667 | $63,717 |
| Median | $63,244 | $61,084 |
| Interquartile 25% (IQ1) | $53,758 | $49,929 |
| Interquartile 75% (IQ3) | $70,255 | $67,721 |
| Interquartile Range (IQR) | $16,497 | $17,792 |
| Standard Deviation (Sample) | $21,981 | $21,463 |
| Standard Deviation (Population) | $21,797 | $21,320 |
Demographics Similar to Egyptians and Immigrants from Croatia by Median Male Earnings
In terms of median male earnings, the demographic groups most similar to Egyptians are Immigrants from Netherlands ($61,096, a difference of 0.0%), Bolivian ($61,066, a difference of 0.050%), Immigrants from Romania ($61,040, a difference of 0.090%), New Zealander ($61,199, a difference of 0.17%), and Immigrants from Pakistan ($60,987, a difference of 0.18%). Similarly, the demographic groups most similar to Immigrants from Croatia are Immigrants from Indonesia ($60,935, a difference of 0.030%), Immigrants from Eastern Europe ($60,958, a difference of 0.070%), Immigrants from Pakistan ($60,987, a difference of 0.12%), Immigrants from Romania ($61,040, a difference of 0.21%), and Bolivian ($61,066, a difference of 0.25%).
| Demographics | Rating | Rank | Median Male Earnings |
| South Africans | 99.9 /100 | #53 | Exceptional $61,460 |
| Immigrants | Latvia | 99.9 /100 | #54 | Exceptional $61,422 |
| Greeks | 99.9 /100 | #55 | Exceptional $61,242 |
| Lithuanians | 99.9 /100 | #56 | Exceptional $61,228 |
| Immigrants | Scotland | 99.9 /100 | #57 | Exceptional $61,220 |
| New Zealanders | 99.9 /100 | #58 | Exceptional $61,199 |
| Immigrants | Netherlands | 99.8 /100 | #59 | Exceptional $61,096 |
| Egyptians | 99.8 /100 | #60 | Exceptional $61,095 |
| Bolivians | 99.8 /100 | #61 | Exceptional $61,066 |
| Immigrants | Romania | 99.8 /100 | #62 | Exceptional $61,040 |
| Immigrants | Pakistan | 99.8 /100 | #63 | Exceptional $60,987 |
| Immigrants | Eastern Europe | 99.8 /100 | #64 | Exceptional $60,958 |
| Immigrants | Indonesia | 99.8 /100 | #65 | Exceptional $60,935 |
| Immigrants | Croatia | 99.8 /100 | #66 | Exceptional $60,914 |
| Immigrants | Spain | 99.8 /100 | #67 | Exceptional $60,750 |
| Immigrants | Serbia | 99.7 /100 | #68 | Exceptional $60,600 |
| Immigrants | Canada | 99.7 /100 | #69 | Exceptional $60,388 |
| Immigrants | Bulgaria | 99.7 /100 | #70 | Exceptional $60,358 |
| Mongolians | 99.7 /100 | #71 | Exceptional $60,350 |
| Immigrants | Western Europe | 99.7 /100 | #72 | Exceptional $60,334 |
| Immigrants | North America | 99.7 /100 | #73 | Exceptional $60,265 |