Ecuadorian vs Immigrants from Cuba Median Earnings
COMPARE
Ecuadorian
Immigrants from Cuba
Median Earnings
Median Earnings Comparison
Ecuadorians
Immigrants from Cuba
$45,214
MEDIAN EARNINGS
15.3/ 100
METRIC RATING
220th/ 347
METRIC RANK
$38,426
MEDIAN EARNINGS
0.0/ 100
METRIC RATING
337th/ 347
METRIC RANK
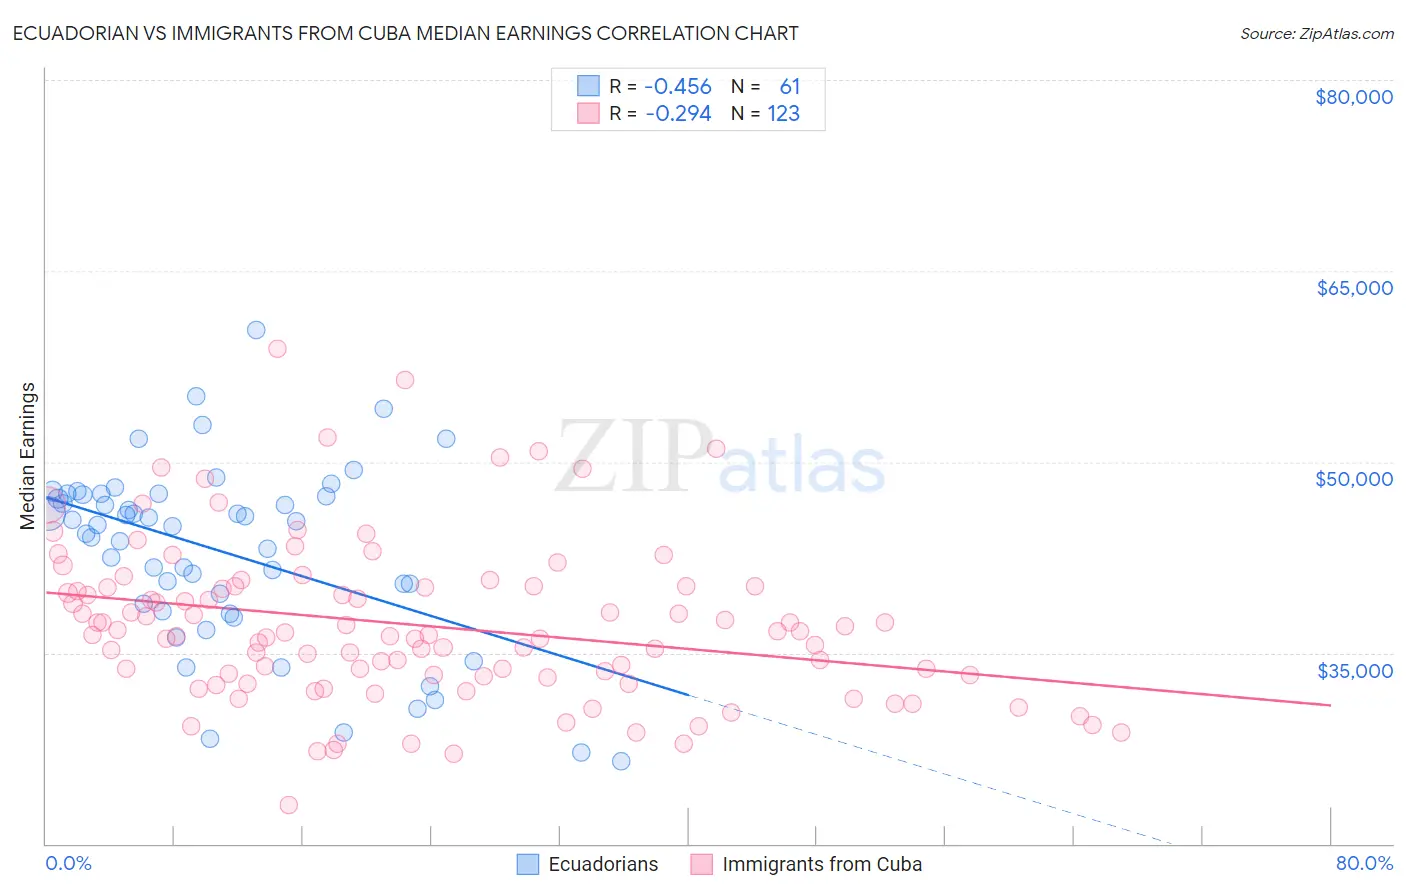
Ecuadorian vs Immigrants from Cuba Median Earnings Correlation Chart
The statistical analysis conducted on geographies consisting of 317,848,977 people shows a moderate negative correlation between the proportion of Ecuadorians and median earnings in the United States with a correlation coefficient (R) of -0.456 and weighted average of $45,214. Similarly, the statistical analysis conducted on geographies consisting of 326,004,649 people shows a weak negative correlation between the proportion of Immigrants from Cuba and median earnings in the United States with a correlation coefficient (R) of -0.294 and weighted average of $38,426, a difference of 17.7%.
Median Earnings Correlation Summary
| Measurement | Ecuadorian | Immigrants from Cuba |
| Minimum | $26,500 | $23,000 |
| Maximum | $60,377 | $58,885 |
| Range | $33,877 | $35,885 |
| Mean | $42,954 | $37,187 |
| Median | $45,047 | $36,411 |
| Interquartile 25% (IQ1) | $38,574 | $33,147 |
| Interquartile 75% (IQ3) | $47,434 | $40,226 |
| Interquartile Range (IQR) | $8,860 | $7,079 |
| Standard Deviation (Sample) | $7,114 | $6,277 |
| Standard Deviation (Population) | $7,055 | $6,251 |
Similar Demographics by Median Earnings
Demographics Similar to Ecuadorians by Median Earnings
In terms of median earnings, the demographic groups most similar to Ecuadorians are Immigrants from Guyana ($45,204, a difference of 0.020%), Immigrants from Panama ($45,198, a difference of 0.030%), White/Caucasian ($45,197, a difference of 0.040%), West Indian ($45,132, a difference of 0.18%), and Immigrants from Cambodia ($45,090, a difference of 0.28%).
| Demographics | Rating | Rank | Median Earnings |
| Immigrants | Colombia | 22.4 /100 | #213 | Fair $45,550 |
| Nigerians | 22.0 /100 | #214 | Fair $45,532 |
| Immigrants | Bangladesh | 22.0 /100 | #215 | Fair $45,532 |
| Guyanese | 20.6 /100 | #216 | Fair $45,470 |
| Tlingit-Haida | 20.5 /100 | #217 | Fair $45,468 |
| Spanish | 19.7 /100 | #218 | Poor $45,432 |
| Dutch | 18.4 /100 | #219 | Poor $45,370 |
| Ecuadorians | 15.3 /100 | #220 | Poor $45,214 |
| Immigrants | Guyana | 15.1 /100 | #221 | Poor $45,204 |
| Immigrants | Panama | 15.0 /100 | #222 | Poor $45,198 |
| Whites/Caucasians | 15.0 /100 | #223 | Poor $45,197 |
| West Indians | 13.9 /100 | #224 | Poor $45,132 |
| Immigrants | Cambodia | 13.2 /100 | #225 | Poor $45,090 |
| Immigrants | Nigeria | 12.2 /100 | #226 | Poor $45,030 |
| Native Hawaiians | 12.2 /100 | #227 | Poor $45,027 |
Demographics Similar to Immigrants from Cuba by Median Earnings
In terms of median earnings, the demographic groups most similar to Immigrants from Cuba are Pima ($38,285, a difference of 0.37%), Crow ($38,707, a difference of 0.73%), Native/Alaskan ($38,896, a difference of 1.2%), Spanish American Indian ($38,907, a difference of 1.3%), and Houma ($38,949, a difference of 1.4%).
| Demographics | Rating | Rank | Median Earnings |
| Immigrants | Congo | 0.0 /100 | #330 | Tragic $39,169 |
| Immigrants | Mexico | 0.0 /100 | #331 | Tragic $39,114 |
| Yakama | 0.0 /100 | #332 | Tragic $39,107 |
| Houma | 0.0 /100 | #333 | Tragic $38,949 |
| Spanish American Indians | 0.0 /100 | #334 | Tragic $38,907 |
| Natives/Alaskans | 0.0 /100 | #335 | Tragic $38,896 |
| Crow | 0.0 /100 | #336 | Tragic $38,707 |
| Immigrants | Cuba | 0.0 /100 | #337 | Tragic $38,426 |
| Pima | 0.0 /100 | #338 | Tragic $38,285 |
| Menominee | 0.0 /100 | #339 | Tragic $37,884 |
| Navajo | 0.0 /100 | #340 | Tragic $36,999 |
| Lumbee | 0.0 /100 | #341 | Tragic $36,876 |
| Hopi | 0.0 /100 | #342 | Tragic $36,871 |
| Pueblo | 0.0 /100 | #343 | Tragic $36,859 |
| Arapaho | 0.0 /100 | #344 | Tragic $36,586 |