Eastern European vs Immigrants from Indonesia Householder Income Over 65 years
COMPARE
Eastern European
Immigrants from Indonesia
Householder Income Over 65 years
Householder Income Over 65 years Comparison
Eastern Europeans
Immigrants from Indonesia
$70,470
HOUSEHOLDER INCOME OVER 65 YEARS
100.0/ 100
METRIC RATING
18th/ 347
METRIC RANK
$66,694
HOUSEHOLDER INCOME OVER 65 YEARS
99.8/ 100
METRIC RATING
49th/ 347
METRIC RANK
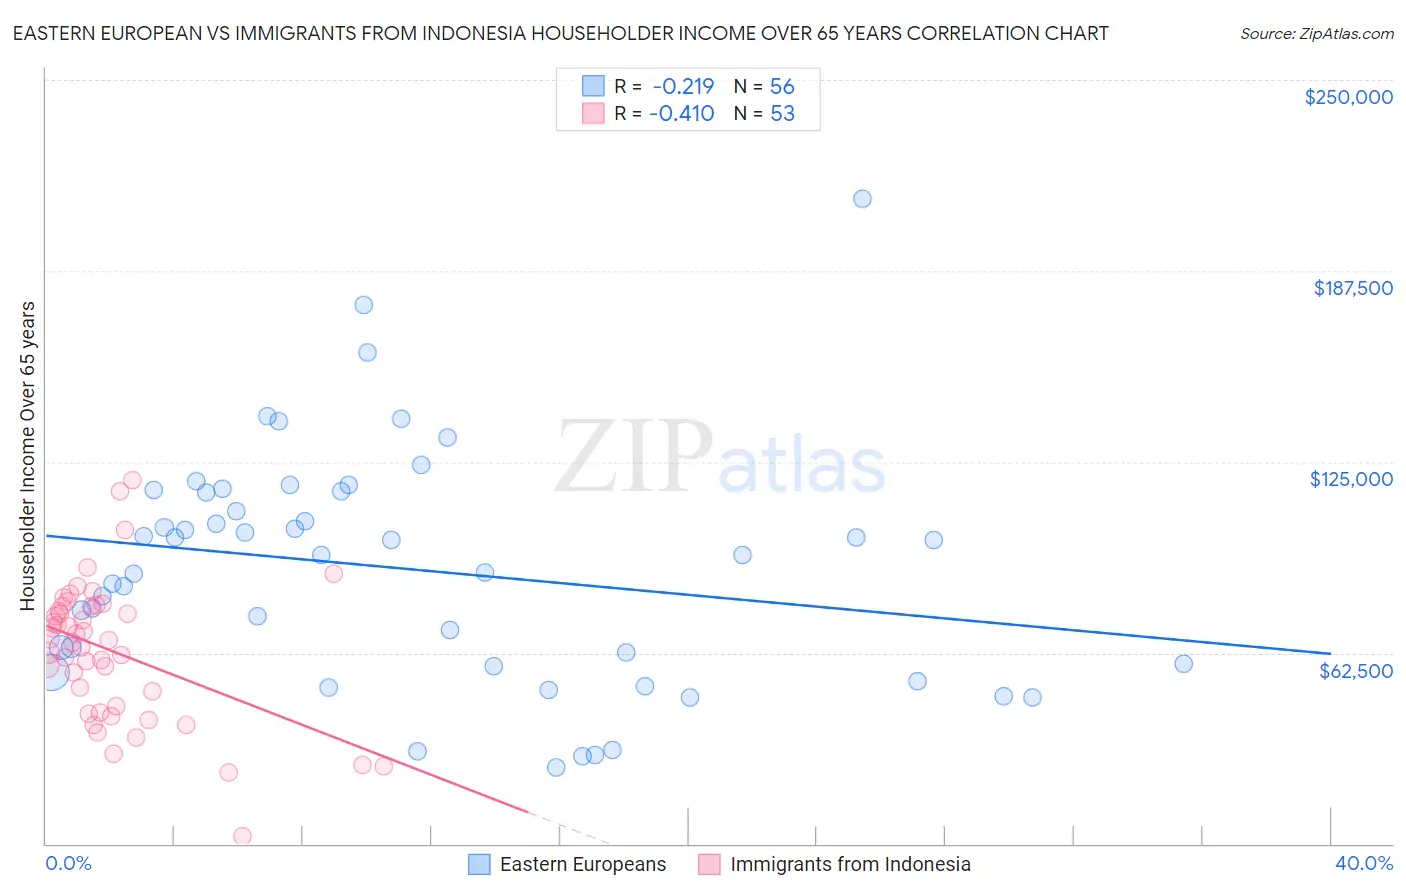
Eastern European vs Immigrants from Indonesia Householder Income Over 65 years Correlation Chart
The statistical analysis conducted on geographies consisting of 459,430,527 people shows a weak negative correlation between the proportion of Eastern Europeans and household income with householder over the age of 65 in the United States with a correlation coefficient (R) of -0.219 and weighted average of $70,470. Similarly, the statistical analysis conducted on geographies consisting of 215,458,271 people shows a moderate negative correlation between the proportion of Immigrants from Indonesia and household income with householder over the age of 65 in the United States with a correlation coefficient (R) of -0.410 and weighted average of $66,694, a difference of 5.7%.
Householder Income Over 65 years Correlation Summary
| Measurement | Eastern European | Immigrants from Indonesia |
| Minimum | $24,862 | $2,499 |
| Maximum | $211,250 | $119,035 |
| Range | $186,388 | $116,536 |
| Mean | $90,025 | $63,155 |
| Median | $94,688 | $66,875 |
| Interquartile 25% (IQ1) | $58,403 | $43,885 |
| Interquartile 75% (IQ3) | $115,041 | $77,853 |
| Interquartile Range (IQR) | $56,638 | $33,968 |
| Standard Deviation (Sample) | $38,316 | $22,797 |
| Standard Deviation (Population) | $37,972 | $22,581 |
Similar Demographics by Householder Income Over 65 years
Demographics Similar to Eastern Europeans by Householder Income Over 65 years
In terms of householder income over 65 years, the demographic groups most similar to Eastern Europeans are Immigrants from Korea ($70,696, a difference of 0.32%), Indian (Asian) ($70,238, a difference of 0.33%), Immigrants from South Central Asia ($70,103, a difference of 0.52%), Okinawan ($70,846, a difference of 0.53%), and Native Hawaiian ($71,021, a difference of 0.78%).
| Demographics | Rating | Rank | Householder Income Over 65 years |
| Thais | 100.0 /100 | #11 | Exceptional $72,099 |
| Cypriots | 100.0 /100 | #12 | Exceptional $71,714 |
| Immigrants | Hong Kong | 100.0 /100 | #13 | Exceptional $71,567 |
| Burmese | 100.0 /100 | #14 | Exceptional $71,139 |
| Native Hawaiians | 100.0 /100 | #15 | Exceptional $71,021 |
| Okinawans | 100.0 /100 | #16 | Exceptional $70,846 |
| Immigrants | Korea | 100.0 /100 | #17 | Exceptional $70,696 |
| Eastern Europeans | 100.0 /100 | #18 | Exceptional $70,470 |
| Indians (Asian) | 100.0 /100 | #19 | Exceptional $70,238 |
| Immigrants | South Central Asia | 100.0 /100 | #20 | Exceptional $70,103 |
| Immigrants | Eastern Asia | 100.0 /100 | #21 | Exceptional $69,872 |
| Immigrants | Israel | 100.0 /100 | #22 | Exceptional $69,857 |
| Immigrants | Japan | 100.0 /100 | #23 | Exceptional $69,774 |
| Immigrants | Sweden | 100.0 /100 | #24 | Exceptional $69,722 |
| Immigrants | Belgium | 100.0 /100 | #25 | Exceptional $69,703 |
Demographics Similar to Immigrants from Indonesia by Householder Income Over 65 years
In terms of householder income over 65 years, the demographic groups most similar to Immigrants from Indonesia are Immigrants from Turkey ($66,672, a difference of 0.030%), Israeli ($66,636, a difference of 0.090%), Immigrants from Scotland ($66,620, a difference of 0.11%), Immigrants from Pakistan ($66,617, a difference of 0.12%), and Immigrants from France ($66,826, a difference of 0.20%).
| Demographics | Rating | Rank | Householder Income Over 65 years |
| New Zealanders | 99.9 /100 | #42 | Exceptional $67,333 |
| Latvians | 99.9 /100 | #43 | Exceptional $67,326 |
| Immigrants | South Africa | 99.9 /100 | #44 | Exceptional $67,234 |
| Immigrants | Afghanistan | 99.8 /100 | #45 | Exceptional $67,007 |
| Cambodians | 99.8 /100 | #46 | Exceptional $66,892 |
| Australians | 99.8 /100 | #47 | Exceptional $66,891 |
| Immigrants | France | 99.8 /100 | #48 | Exceptional $66,826 |
| Immigrants | Indonesia | 99.8 /100 | #49 | Exceptional $66,694 |
| Immigrants | Turkey | 99.7 /100 | #50 | Exceptional $66,672 |
| Israelis | 99.7 /100 | #51 | Exceptional $66,636 |
| Immigrants | Scotland | 99.7 /100 | #52 | Exceptional $66,620 |
| Immigrants | Pakistan | 99.7 /100 | #53 | Exceptional $66,617 |
| Immigrants | Netherlands | 99.7 /100 | #54 | Exceptional $66,463 |
| Immigrants | Czechoslovakia | 99.7 /100 | #55 | Exceptional $66,376 |
| Laotians | 99.6 /100 | #56 | Exceptional $66,306 |