Dutch West Indian vs Immigrants from Norway Median Male Earnings
COMPARE
Dutch West Indian
Immigrants from Norway
Median Male Earnings
Median Male Earnings Comparison
Dutch West Indians
Immigrants from Norway
$46,656
MEDIAN MALE EARNINGS
0.0/ 100
METRIC RATING
306th/ 347
METRIC RANK
$61,628
MEDIAN MALE EARNINGS
99.9/ 100
METRIC RATING
52nd/ 347
METRIC RANK
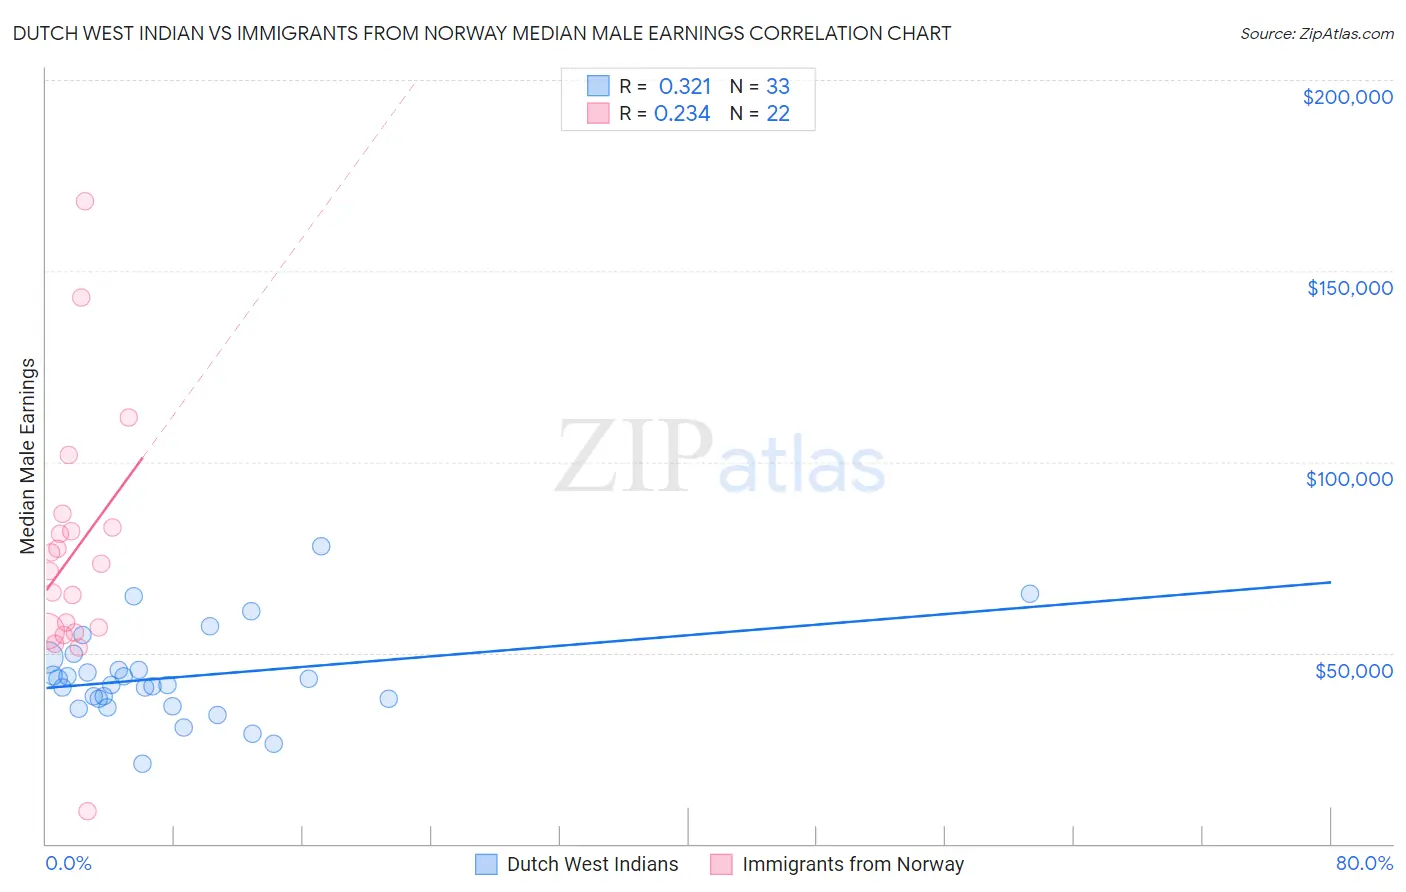
Dutch West Indian vs Immigrants from Norway Median Male Earnings Correlation Chart
The statistical analysis conducted on geographies consisting of 85,752,443 people shows a mild positive correlation between the proportion of Dutch West Indians and median male earnings in the United States with a correlation coefficient (R) of 0.321 and weighted average of $46,656. Similarly, the statistical analysis conducted on geographies consisting of 116,702,945 people shows a weak positive correlation between the proportion of Immigrants from Norway and median male earnings in the United States with a correlation coefficient (R) of 0.234 and weighted average of $61,628, a difference of 32.1%.
Median Male Earnings Correlation Summary
| Measurement | Dutch West Indian | Immigrants from Norway |
| Minimum | $20,833 | $8,547 |
| Maximum | $78,036 | $168,268 |
| Range | $57,203 | $159,721 |
| Mean | $43,636 | $76,311 |
| Median | $41,596 | $72,426 |
| Interquartile 25% (IQ1) | $37,034 | $55,593 |
| Interquartile 75% (IQ3) | $47,172 | $82,963 |
| Interquartile Range (IQR) | $10,138 | $27,370 |
| Standard Deviation (Sample) | $11,759 | $33,202 |
| Standard Deviation (Population) | $11,579 | $32,439 |
Similar Demographics by Median Male Earnings
Demographics Similar to Dutch West Indians by Median Male Earnings
In terms of median male earnings, the demographic groups most similar to Dutch West Indians are Immigrants from Dominican Republic ($46,655, a difference of 0.0%), Ottawa ($46,611, a difference of 0.10%), Creek ($46,594, a difference of 0.13%), Cuban ($46,580, a difference of 0.16%), and Guatemalan ($46,736, a difference of 0.17%).
| Demographics | Rating | Rank | Median Male Earnings |
| Immigrants | Zaire | 0.1 /100 | #299 | Tragic $47,070 |
| U.S. Virgin Islanders | 0.1 /100 | #300 | Tragic $47,066 |
| Immigrants | Latin America | 0.1 /100 | #301 | Tragic $46,941 |
| Seminole | 0.1 /100 | #302 | Tragic $46,783 |
| Yaqui | 0.1 /100 | #303 | Tragic $46,777 |
| Bangladeshis | 0.1 /100 | #304 | Tragic $46,744 |
| Guatemalans | 0.0 /100 | #305 | Tragic $46,736 |
| Dutch West Indians | 0.0 /100 | #306 | Tragic $46,656 |
| Immigrants | Dominican Republic | 0.0 /100 | #307 | Tragic $46,655 |
| Ottawa | 0.0 /100 | #308 | Tragic $46,611 |
| Creek | 0.0 /100 | #309 | Tragic $46,594 |
| Cubans | 0.0 /100 | #310 | Tragic $46,580 |
| Apache | 0.0 /100 | #311 | Tragic $46,429 |
| Hispanics or Latinos | 0.0 /100 | #312 | Tragic $46,419 |
| Hondurans | 0.0 /100 | #313 | Tragic $46,374 |
Demographics Similar to Immigrants from Norway by Median Male Earnings
In terms of median male earnings, the demographic groups most similar to Immigrants from Norway are Estonian ($61,710, a difference of 0.13%), Bhutanese ($61,759, a difference of 0.21%), South African ($61,460, a difference of 0.27%), Immigrants from Latvia ($61,422, a difference of 0.34%), and Greek ($61,242, a difference of 0.63%).
| Demographics | Rating | Rank | Median Male Earnings |
| Bulgarians | 100.0 /100 | #45 | Exceptional $62,378 |
| Immigrants | Czechoslovakia | 99.9 /100 | #46 | Exceptional $62,217 |
| Immigrants | Austria | 99.9 /100 | #47 | Exceptional $62,164 |
| Immigrants | Malaysia | 99.9 /100 | #48 | Exceptional $62,121 |
| Immigrants | Europe | 99.9 /100 | #49 | Exceptional $62,057 |
| Bhutanese | 99.9 /100 | #50 | Exceptional $61,759 |
| Estonians | 99.9 /100 | #51 | Exceptional $61,710 |
| Immigrants | Norway | 99.9 /100 | #52 | Exceptional $61,628 |
| South Africans | 99.9 /100 | #53 | Exceptional $61,460 |
| Immigrants | Latvia | 99.9 /100 | #54 | Exceptional $61,422 |
| Greeks | 99.9 /100 | #55 | Exceptional $61,242 |
| Lithuanians | 99.9 /100 | #56 | Exceptional $61,228 |
| Immigrants | Scotland | 99.9 /100 | #57 | Exceptional $61,220 |
| New Zealanders | 99.9 /100 | #58 | Exceptional $61,199 |
| Immigrants | Netherlands | 99.8 /100 | #59 | Exceptional $61,096 |