Dutch West Indian vs Immigrants from Ghana Householder Income Over 65 years
COMPARE
Dutch West Indian
Immigrants from Ghana
Householder Income Over 65 years
Householder Income Over 65 years Comparison
Dutch West Indians
Immigrants from Ghana
$50,475
HOUSEHOLDER INCOME OVER 65 YEARS
0.0/ 100
METRIC RATING
332nd/ 347
METRIC RANK
$58,624
HOUSEHOLDER INCOME OVER 65 YEARS
7.9/ 100
METRIC RATING
215th/ 347
METRIC RANK
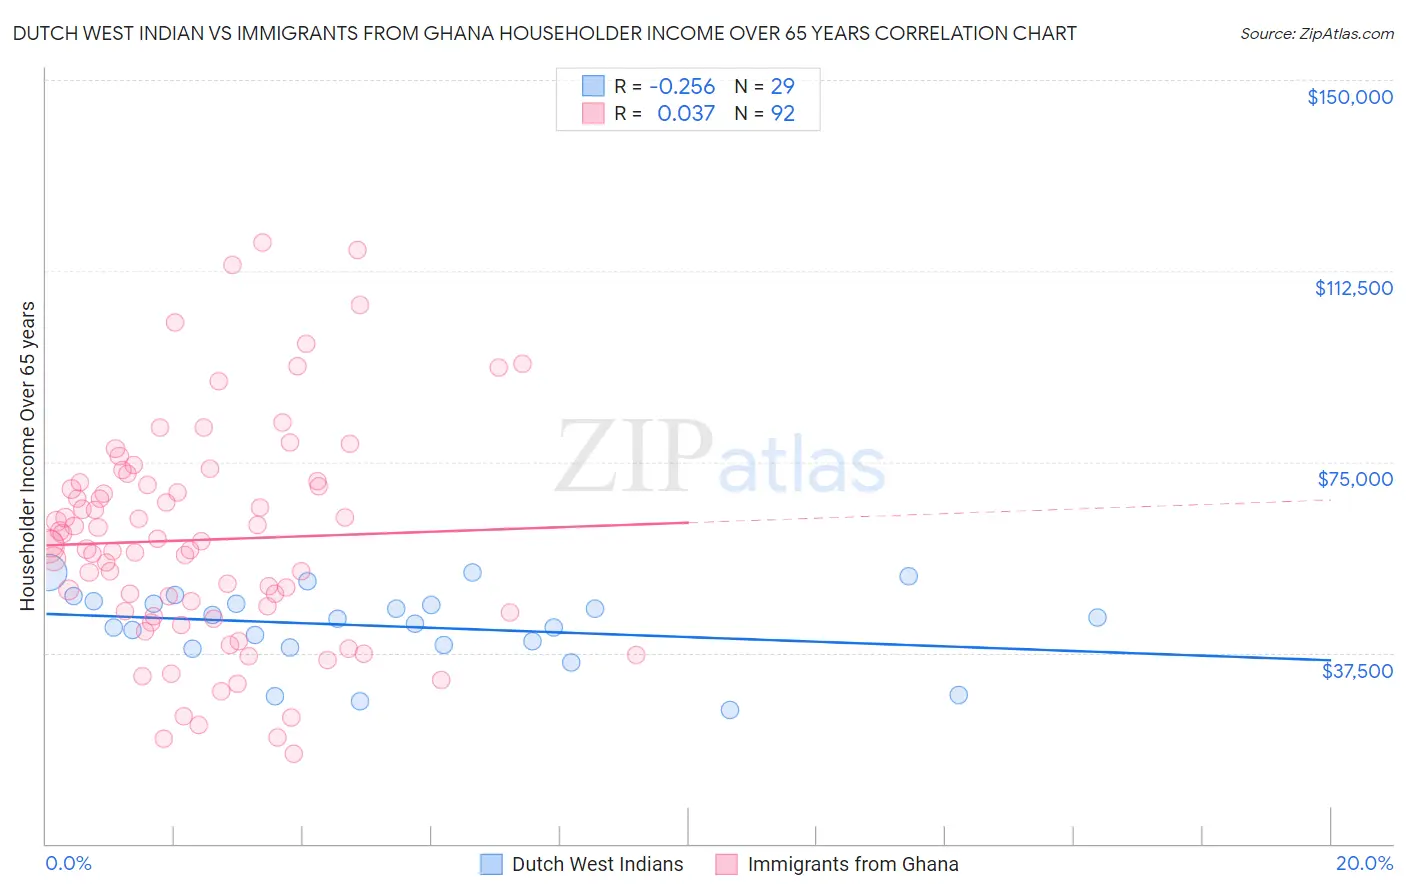
Dutch West Indian vs Immigrants from Ghana Householder Income Over 65 years Correlation Chart
The statistical analysis conducted on geographies consisting of 85,634,723 people shows a weak negative correlation between the proportion of Dutch West Indians and household income with householder over the age of 65 in the United States with a correlation coefficient (R) of -0.256 and weighted average of $50,475. Similarly, the statistical analysis conducted on geographies consisting of 199,306,105 people shows no correlation between the proportion of Immigrants from Ghana and household income with householder over the age of 65 in the United States with a correlation coefficient (R) of 0.037 and weighted average of $58,624, a difference of 16.1%.
Householder Income Over 65 years Correlation Summary
| Measurement | Dutch West Indian | Immigrants from Ghana |
| Minimum | $26,250 | $17,788 |
| Maximum | $53,313 | $118,015 |
| Range | $27,063 | $100,227 |
| Mean | $42,695 | $59,709 |
| Median | $44,110 | $58,613 |
| Interquartile 25% (IQ1) | $38,754 | $45,151 |
| Interquartile 75% (IQ3) | $47,478 | $70,697 |
| Interquartile Range (IQR) | $8,725 | $25,546 |
| Standard Deviation (Sample) | $7,469 | $21,702 |
| Standard Deviation (Population) | $7,339 | $21,584 |
Similar Demographics by Householder Income Over 65 years
Demographics Similar to Dutch West Indians by Householder Income Over 65 years
In terms of householder income over 65 years, the demographic groups most similar to Dutch West Indians are Pima ($50,539, a difference of 0.13%), Immigrants from Grenada ($50,747, a difference of 0.54%), Black/African American ($50,779, a difference of 0.60%), Cape Verdean ($50,077, a difference of 0.79%), and Immigrants from Dominica ($50,071, a difference of 0.81%).
| Demographics | Rating | Rank | Householder Income Over 65 years |
| Immigrants | Haiti | 0.0 /100 | #325 | Tragic $51,219 |
| Kiowa | 0.0 /100 | #326 | Tragic $51,140 |
| Bahamians | 0.0 /100 | #327 | Tragic $51,000 |
| Hopi | 0.0 /100 | #328 | Tragic $50,925 |
| Blacks/African Americans | 0.0 /100 | #329 | Tragic $50,779 |
| Immigrants | Grenada | 0.0 /100 | #330 | Tragic $50,747 |
| Pima | 0.0 /100 | #331 | Tragic $50,539 |
| Dutch West Indians | 0.0 /100 | #332 | Tragic $50,475 |
| Cape Verdeans | 0.0 /100 | #333 | Tragic $50,077 |
| Immigrants | Dominica | 0.0 /100 | #334 | Tragic $50,071 |
| Crow | 0.0 /100 | #335 | Tragic $49,234 |
| Cubans | 0.0 /100 | #336 | Tragic $49,152 |
| Tohono O'odham | 0.0 /100 | #337 | Tragic $49,121 |
| Immigrants | Caribbean | 0.0 /100 | #338 | Tragic $48,535 |
| Navajo | 0.0 /100 | #339 | Tragic $47,722 |
Demographics Similar to Immigrants from Ghana by Householder Income Over 65 years
In terms of householder income over 65 years, the demographic groups most similar to Immigrants from Ghana are Nepalese ($58,761, a difference of 0.23%), White/Caucasian ($58,847, a difference of 0.38%), Colombian ($58,851, a difference of 0.39%), Immigrants from Middle Africa ($58,375, a difference of 0.43%), and Immigrants from Nigeria ($58,942, a difference of 0.54%).
| Demographics | Rating | Rank | Householder Income Over 65 years |
| Uruguayans | 12.3 /100 | #208 | Poor $59,090 |
| Slovaks | 11.7 /100 | #209 | Poor $59,039 |
| Nigerians | 11.2 /100 | #210 | Poor $58,992 |
| Immigrants | Nigeria | 10.7 /100 | #211 | Poor $58,942 |
| Colombians | 9.8 /100 | #212 | Tragic $58,851 |
| Whites/Caucasians | 9.8 /100 | #213 | Tragic $58,847 |
| Nepalese | 9.0 /100 | #214 | Tragic $58,761 |
| Immigrants | Ghana | 7.9 /100 | #215 | Tragic $58,624 |
| Immigrants | Middle Africa | 6.2 /100 | #216 | Tragic $58,375 |
| Sudanese | 5.7 /100 | #217 | Tragic $58,281 |
| Panamanians | 5.6 /100 | #218 | Tragic $58,266 |
| Malaysians | 5.5 /100 | #219 | Tragic $58,244 |
| Yugoslavians | 5.5 /100 | #220 | Tragic $58,243 |
| Immigrants | El Salvador | 5.4 /100 | #221 | Tragic $58,226 |
| Delaware | 5.3 /100 | #222 | Tragic $58,214 |