Dutch West Indian vs Armenian Householder Income Under 25 years

COMPARE

Dutch West Indian
Race
Ancestry
AfghanAfricanAlaska NativeAlaskan AthabascanAlbanianAleutAlsatianAmericanApacheArabArapahoArgentineanAssyrian/Chaldean/SyriacAustralianAustrianBahamianBangladeshiBarbadianBasqueBelgianBelizeanBermudanBhutaneseBlackfeetBolivianBrazilianBritishBritish West IndianBulgarianBurmeseCajunCambodianCanadianCape VerdeanCarpatho RusynCelticCentral AmericanCentral American IndianCherokeeCheyenneChickasawChileanChineseChippewaChoctawColombianColvilleComancheCosta RicanCreeCreekCroatianCrowCubanCypriotCzechCzechoslovakianDanishDelawareDominicanDutchDutch West IndianEastern EuropeanEcuadorianEgyptianEnglishEstonianEthiopianEuropeanFijianFilipinoFinnishFrenchFrench American IndianFrench CanadianGermanGerman RussianGhanaianGreekGuamanian/ChamorroGuatemalanGuyaneseHaitianHmongHonduranHopiHoumaHungarianIcelanderIndian (Asian)IndonesianInupiatIranianIraqiIrishIroquoisIsraeliItalianJamaicanJapaneseJordanianKenyanKiowaKoreanLaotianLatvianLebaneseLiberianLithuanianLumbeeLuxembourgerMacedonianMalaysianMalteseMarshalleseMenomineeMexicanMexican American IndianMongolianMoroccanNative HawaiianNavajoNepaleseNew ZealanderNicaraguanNigerianNorthern EuropeanNorwegianOkinawanOsageOttawaPaiutePakistaniPalestinianPanamanianParaguayanPennsylvania GermanPeruvianPimaPolishPortuguesePotawatomiPuebloPuerto RicanPuget Sound SalishRomanianRussianSalvadoranSamoanScandinavianScotch-IrishScottishSeminoleSenegaleseSerbianShoshoneSierra LeoneanSiouxSlavicSlovakSloveneSomaliSouth AfricanSouth AmericanSouth American IndianSoviet UnionSpaniardSpanishSpanish AmericanSpanish American IndianSri LankanSubsaharan AfricanSudaneseSwedishSwissSyrianTaiwaneseThaiTlingit-HaidaTohono O'OdhamTonganTrinidadian and TobagonianTsimshianTurkishU.S. Virgin IslanderUgandanUkrainianUruguayanUteVenezuelanVietnameseWelshWest IndianYakamaYaquiYugoslavianYumanYup'ikZimbabwean
Immigration
NonimmigrantsImmigrantsAfghanistanAfricaAlbaniaArgentinaArmeniaAsiaAustraliaAustriaBahamasBangladeshBarbadosBelarusBelgiumBelizeBoliviaBosnia and HerzegovinaBrazilBulgariaBurma/MyanmarCabo VerdeCambodiaCameroonCanadaCaribbeanCentral AmericaChileChinaColombiaCongoCosta RicaCroatiaCubaCzechoslovakiaDenmarkDominicaDominican RepublicEastern AfricaEastern AsiaEastern EuropeEcuadorEgyptEl SalvadorEnglandEritreaEthiopiaEuropeFijiFranceGermanyGhanaGreeceGrenadaGuatemalaGuyanaHaitiHondurasHong KongHungaryIndiaIndonesiaIranIraqIrelandIsraelItalyJamaicaJapanJordanKazakhstanKenyaKoreaKuwaitLaosLatin AmericaLatviaLebanonLiberiaLithuaniaMalaysiaMexicoMicronesiaMiddle AfricaMoldovaMoroccoNepalNetherlandsNicaraguaNigeriaNorth AmericaNorth MacedoniaNorthern AfricaNorthern EuropeNorwayOceaniaPakistanPanamaPeruPhilippinesPolandPortugalRomaniaRussiaSaudi ArabiaScotlandSenegalSerbiaSierra LeoneSingaporeSomaliaSouth AfricaSouth AmericaSouth Central AsiaSouth Eastern AsiaSouthern EuropeSpainSri LankaSt. Vincent and the GrenadinesSudanSwedenSwitzerlandSyriaTaiwanThailandTrinidad and TobagoTurkeyUgandaUkraineUruguayUzbekistanVenezuelaVietnamWest IndiesWestern AfricaWestern AsiaWestern EuropeYemenZaireZimbabweAzores
Armenian
Race
Ancestry
AfghanAfricanAlaska NativeAlaskan AthabascanAlbanianAleutAlsatianAmericanApacheArabArapahoArgentineanArmenianAssyrian/Chaldean/SyriacAustralianAustrianBahamianBangladeshiBarbadianBasqueBelgianBelizeanBermudanBhutaneseBlackfeetBolivianBrazilianBritishBritish West IndianBulgarianBurmeseCajunCambodianCanadianCape VerdeanCarpatho RusynCelticCentral AmericanCentral American IndianCherokeeCheyenneChickasawChileanChineseChippewaChoctawColombianColvilleComancheCosta RicanCreeCreekCroatianCrowCubanCypriotCzechCzechoslovakianDanishDelawareDominicanDutchEastern EuropeanEcuadorianEgyptianEnglishEstonianEthiopianEuropeanFijianFilipinoFinnishFrenchFrench American IndianFrench CanadianGermanGerman RussianGhanaianGreekGuamanian/ChamorroGuatemalanGuyaneseHaitianHmongHonduranHopiHoumaHungarianIcelanderIndian (Asian)IndonesianInupiatIranianIraqiIrishIroquoisIsraeliItalianJamaicanJapaneseJordanianKenyanKiowaKoreanLaotianLatvianLebaneseLiberianLithuanianLumbeeLuxembourgerMacedonianMalaysianMalteseMarshalleseMenomineeMexicanMexican American IndianMongolianMoroccanNative HawaiianNavajoNepaleseNew ZealanderNicaraguanNigerianNorthern EuropeanNorwegianOkinawanOsageOttawaPaiutePakistaniPalestinianPanamanianParaguayanPennsylvania GermanPeruvianPimaPolishPortuguesePotawatomiPuebloPuerto RicanPuget Sound SalishRomanianRussianSalvadoranSamoanScandinavianScotch-IrishScottishSeminoleSenegaleseSerbianShoshoneSierra LeoneanSiouxSlavicSlovakSloveneSomaliSouth AfricanSouth AmericanSouth American IndianSoviet UnionSpaniardSpanishSpanish AmericanSpanish American IndianSri LankanSubsaharan AfricanSudaneseSwedishSwissSyrianTaiwaneseThaiTlingit-HaidaTohono O'OdhamTonganTrinidadian and TobagonianTsimshianTurkishU.S. Virgin IslanderUgandanUkrainianUruguayanUteVenezuelanVietnameseWelshWest IndianYakamaYaquiYugoslavianYumanYup'ikZimbabwean
Immigration
NonimmigrantsImmigrantsAfghanistanAfricaAlbaniaArgentinaArmeniaAsiaAustraliaAustriaBahamasBangladeshBarbadosBelarusBelgiumBelizeBoliviaBosnia and HerzegovinaBrazilBulgariaBurma/MyanmarCabo VerdeCambodiaCameroonCanadaCaribbeanCentral AmericaChileChinaColombiaCongoCosta RicaCroatiaCubaCzechoslovakiaDenmarkDominicaDominican RepublicEastern AfricaEastern AsiaEastern EuropeEcuadorEgyptEl SalvadorEnglandEritreaEthiopiaEuropeFijiFranceGermanyGhanaGreeceGrenadaGuatemalaGuyanaHaitiHondurasHong KongHungaryIndiaIndonesiaIranIraqIrelandIsraelItalyJamaicaJapanJordanKazakhstanKenyaKoreaKuwaitLaosLatin AmericaLatviaLebanonLiberiaLithuaniaMalaysiaMexicoMicronesiaMiddle AfricaMoldovaMoroccoNepalNetherlandsNicaraguaNigeriaNorth AmericaNorth MacedoniaNorthern AfricaNorthern EuropeNorwayOceaniaPakistanPanamaPeruPhilippinesPolandPortugalRomaniaRussiaSaudi ArabiaScotlandSenegalSerbiaSierra LeoneSingaporeSomaliaSouth AfricaSouth AmericaSouth Central AsiaSouth Eastern AsiaSouthern EuropeSpainSri LankaSt. Vincent and the GrenadinesSudanSwedenSwitzerlandSyriaTaiwanThailandTrinidad and TobagoTurkeyUgandaUkraineUruguayUzbekistanVenezuelaVietnamWest IndiesWestern AfricaWestern AsiaWestern EuropeYemenZaireZimbabweAzores
Householder Income Under 25 years
Income
Poverty
Unemployment
Labor Participation
Family Structure
Vehicle Availability
Education Level
Disability

Householder Income Under 25 years Comparison

Dutch West Indians

Armenians

Tragic
Exceptional
$45,816
HOUSEHOLDER INCOME UNDER 25 YEARS
0.0/ 100
METRIC RATING
324th/ 347
METRIC RANK
$53,179
HOUSEHOLDER INCOME UNDER 25 YEARS
91.8/ 100
METRIC RATING
136th/ 347
METRIC RANK

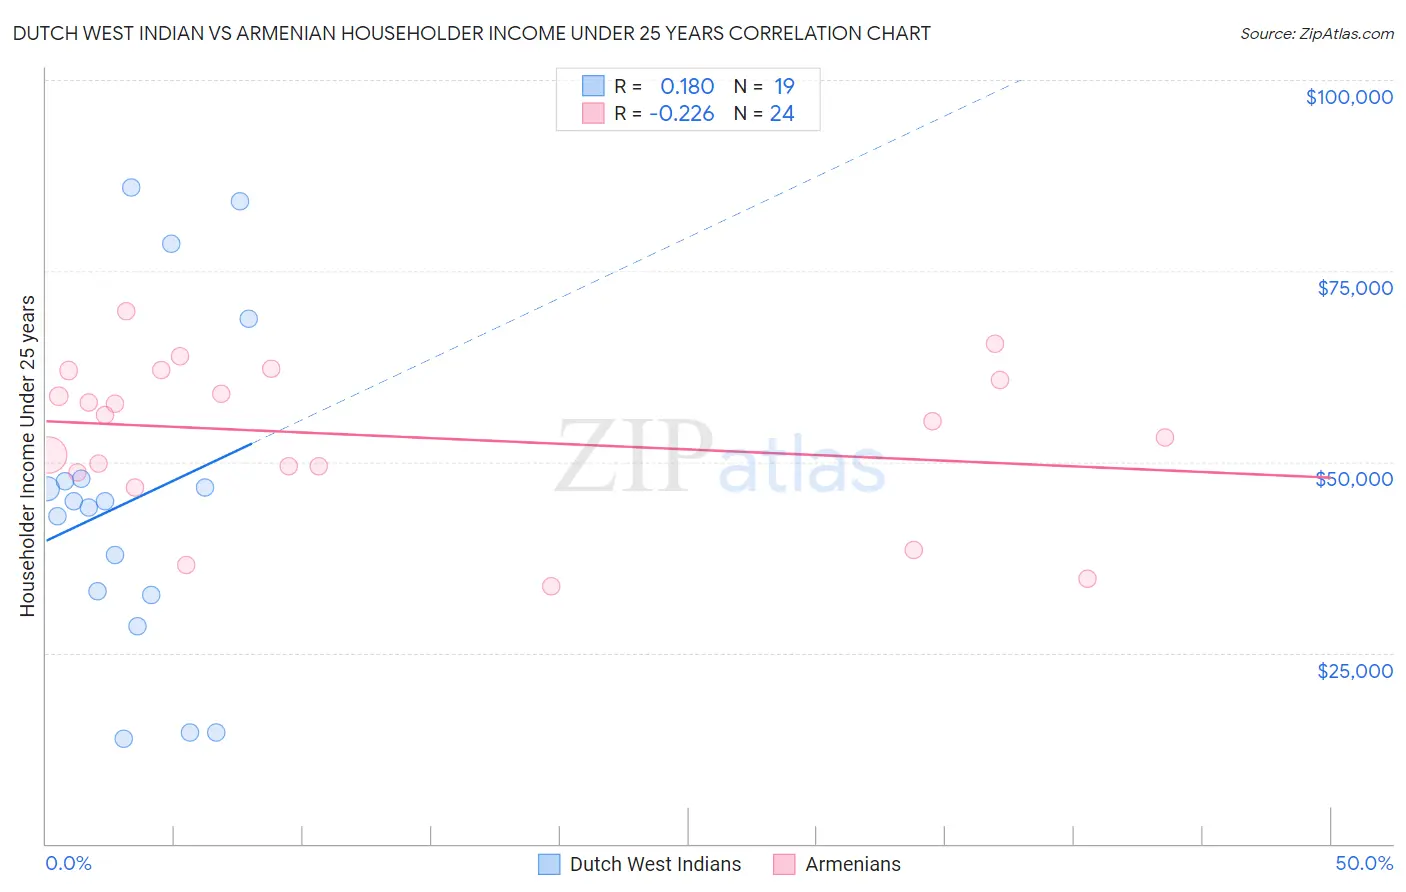
Dutch West Indian vs Armenian Householder Income Under 25 years Correlation Chart

The statistical analysis conducted on geographies consisting of 80,349,978 people shows a poor positive correlation between the proportion of Dutch West Indians and household income with householder under the age of 25 in the United States with a correlation coefficient (R) of 0.180 and weighted average of $45,816. Similarly, the statistical analysis conducted on geographies consisting of 263,357,605 people shows a weak negative correlation between the proportion of Armenians and household income with householder under the age of 25 in the United States with a correlation coefficient (R) of -0.226 and weighted average of $53,179, a difference of 16.1%.
Dutch West Indian vs Armenian Householder Income Under 25 years

Householder Income Under 25 years Correlation Summary

MeasurementDutch West IndianArmenian
Minimum$13,750$33,721
Maximum$85,865$69,694
Range$72,115$35,973
Mean$45,099$53,386
Median$44,797$55,696
Interquartile 25% (IQ1)$32,543$48,981
Interquartile 75% (IQ3)$47,825$61,303
Interquartile Range (IQR)$15,281$12,322
Standard Deviation (Sample)$21,553$9,927
Standard Deviation (Population)$20,979$9,718

Similar Demographics by Householder Income Under 25 years

Demographics Similar to Dutch West Indians by Householder Income Under 25 years

In terms of householder income under 25 years, the demographic groups most similar to Dutch West Indians are Immigrants from Bahamas ($45,793, a difference of 0.050%), Osage ($45,764, a difference of 0.11%), Bahamian ($45,743, a difference of 0.16%), German Russian ($45,673, a difference of 0.31%), and Seminole ($45,649, a difference of 0.37%).
DemographicsRating | RankHouseholder Income Under 25 years
Hopi
0.0
/100
|
#317
Tragic
$46,978
Spanish Americans
0.0
/100
|
#318
Tragic
$46,913
Africans
0.0
/100
|
#319
Tragic
$46,838
Immigrants | Sudan
0.0
/100
|
#320
Tragic
$46,791
Potawatomi
0.0
/100
|
#321
Tragic
$46,462
Sioux
0.0
/100
|
#322
Tragic
$46,417
Immigrants | Saudi Arabia
0.0
/100
|
#323
Tragic
$46,187
Dutch West Indians
0.0
/100
|
#324
Tragic
$45,816
Immigrants | Bahamas
0.0
/100
|
#325
Tragic
$45,793
Osage
0.0
/100
|
#326
Tragic
$45,764
Bahamians
0.0
/100
|
#327
Tragic
$45,743
German Russians
0.0
/100
|
#328
Tragic
$45,673
Seminole
0.0
/100
|
#329
Tragic
$45,649
Indonesians
0.0
/100
|
#330
Tragic
$45,566
Immigrants | Zaire
0.0
/100
|
#331
Tragic
$45,529

Demographics Similar to Armenians by Householder Income Under 25 years

In terms of householder income under 25 years, the demographic groups most similar to Armenians are Immigrants from Northern Africa ($53,185, a difference of 0.010%), Chilean ($53,185, a difference of 0.010%), Immigrants from Barbados ($53,163, a difference of 0.030%), Immigrants ($53,201, a difference of 0.040%), and Norwegian ($53,127, a difference of 0.10%).
DemographicsRating | RankHouseholder Income Under 25 years
New Zealanders
93.7
/100
|
#129
Exceptional
$53,294
Nicaraguans
93.4
/100
|
#130
Exceptional
$53,275
Immigrants | Nicaragua
93.3
/100
|
#131
Exceptional
$53,266
Moroccans
93.1
/100
|
#132
Exceptional
$53,256
Immigrants | Immigrants
92.2
/100
|
#133
Exceptional
$53,201
Immigrants | Northern Africa
91.9
/100
|
#134
Exceptional
$53,185
Chileans
91.9
/100
|
#135
Exceptional
$53,185
Armenians
91.8
/100
|
#136
Exceptional
$53,179
Immigrants | Barbados
91.5
/100
|
#137
Exceptional
$53,163
Norwegians
90.8
/100
|
#138
Exceptional
$53,127
Costa Ricans
90.4
/100
|
#139
Exceptional
$53,106
Hawaiians
89.8
/100
|
#140
Excellent
$53,078
Danes
88.9
/100
|
#141
Excellent
$53,041
Immigrants | Armenia
87.5
/100
|
#142
Excellent
$52,986
Swedes
87.5
/100
|
#143
Excellent
$52,986