Danish vs British West Indian Per Capita Income
COMPARE
Danish
British West Indian
Per Capita Income
Per Capita Income Comparison
Danes
British West Indians
$44,095
PER CAPITA INCOME
61.9/ 100
METRIC RATING
160th/ 347
METRIC RANK
$40,330
PER CAPITA INCOME
2.3/ 100
METRIC RATING
241st/ 347
METRIC RANK
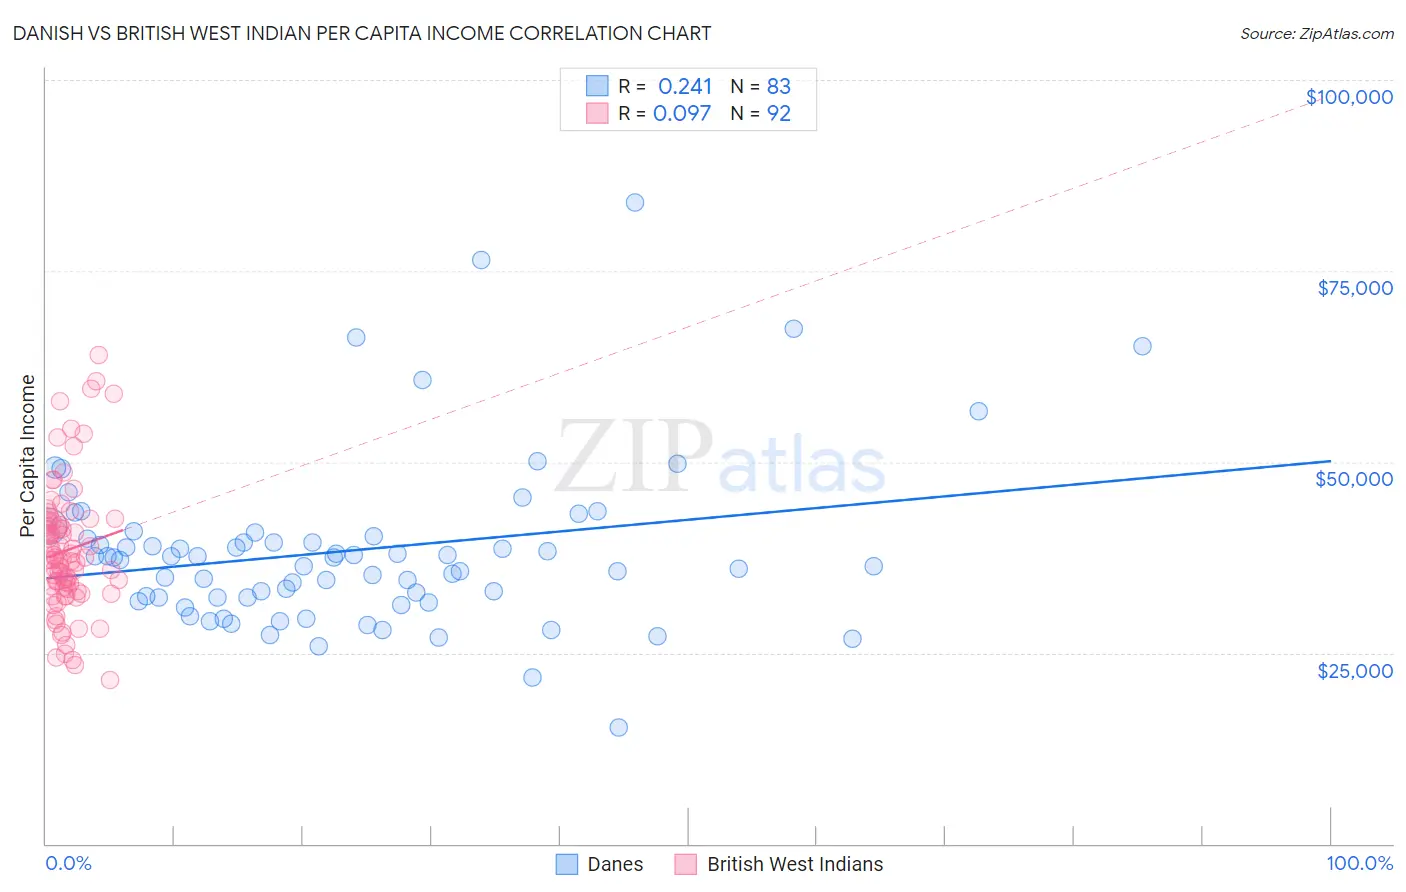
Danish vs British West Indian Per Capita Income Correlation Chart
The statistical analysis conducted on geographies consisting of 474,208,442 people shows a weak positive correlation between the proportion of Danes and per capita income in the United States with a correlation coefficient (R) of 0.241 and weighted average of $44,095. Similarly, the statistical analysis conducted on geographies consisting of 152,702,927 people shows a slight positive correlation between the proportion of British West Indians and per capita income in the United States with a correlation coefficient (R) of 0.097 and weighted average of $40,330, a difference of 9.3%.
Per Capita Income Correlation Summary
| Measurement | Danish | British West Indian |
| Minimum | $15,232 | $21,502 |
| Maximum | $83,892 | $63,988 |
| Range | $68,660 | $42,486 |
| Mean | $38,430 | $38,416 |
| Median | $37,481 | $37,296 |
| Interquartile 25% (IQ1) | $32,272 | $33,460 |
| Interquartile 75% (IQ3) | $40,294 | $42,145 |
| Interquartile Range (IQR) | $8,022 | $8,686 |
| Standard Deviation (Sample) | $11,196 | $8,471 |
| Standard Deviation (Population) | $11,128 | $8,425 |
Similar Demographics by Per Capita Income
Demographics Similar to Danes by Per Capita Income
In terms of per capita income, the demographic groups most similar to Danes are Costa Rican ($44,090, a difference of 0.010%), South American ($44,114, a difference of 0.040%), Swiss ($44,076, a difference of 0.040%), Immigrants from South America ($44,068, a difference of 0.060%), and Sri Lankan ($44,014, a difference of 0.18%).
| Demographics | Rating | Rank | Per Capita Income |
| Scottish | 70.6 /100 | #153 | Good $44,440 |
| Portuguese | 68.7 /100 | #154 | Good $44,362 |
| Uruguayans | 67.6 /100 | #155 | Good $44,318 |
| Slovaks | 65.4 /100 | #156 | Good $44,229 |
| South American Indians | 64.8 /100 | #157 | Good $44,206 |
| Immigrants | Nepal | 64.3 /100 | #158 | Good $44,187 |
| South Americans | 62.4 /100 | #159 | Good $44,114 |
| Danes | 61.9 /100 | #160 | Good $44,095 |
| Costa Ricans | 61.8 /100 | #161 | Good $44,090 |
| Swiss | 61.4 /100 | #162 | Good $44,076 |
| Immigrants | South America | 61.2 /100 | #163 | Good $44,068 |
| Sri Lankans | 59.8 /100 | #164 | Average $44,014 |
| Immigrants | Philippines | 59.4 /100 | #165 | Average $44,000 |
| Immigrants | Uruguay | 59.3 /100 | #166 | Average $43,997 |
| English | 58.9 /100 | #167 | Average $43,982 |
Demographics Similar to British West Indians by Per Capita Income
In terms of per capita income, the demographic groups most similar to British West Indians are Immigrants from Nigeria ($40,339, a difference of 0.020%), Tsimshian ($40,344, a difference of 0.040%), Somali ($40,367, a difference of 0.090%), Immigrants from Western Africa ($40,294, a difference of 0.090%), and German Russian ($40,266, a difference of 0.16%).
| Demographics | Rating | Rank | Per Capita Income |
| Immigrants | West Indies | 3.7 /100 | #234 | Tragic $40,763 |
| Immigrants | Guyana | 3.6 /100 | #235 | Tragic $40,742 |
| Immigrants | Nonimmigrants | 3.4 /100 | #236 | Tragic $40,669 |
| Immigrants | Cambodia | 2.6 /100 | #237 | Tragic $40,434 |
| Somalis | 2.4 /100 | #238 | Tragic $40,367 |
| Tsimshian | 2.4 /100 | #239 | Tragic $40,344 |
| Immigrants | Nigeria | 2.3 /100 | #240 | Tragic $40,339 |
| British West Indians | 2.3 /100 | #241 | Tragic $40,330 |
| Immigrants | Western Africa | 2.2 /100 | #242 | Tragic $40,294 |
| German Russians | 2.2 /100 | #243 | Tragic $40,266 |
| French American Indians | 2.1 /100 | #244 | Tragic $40,244 |
| Sub-Saharan Africans | 1.9 /100 | #245 | Tragic $40,152 |
| Cree | 1.7 /100 | #246 | Tragic $40,056 |
| Immigrants | Somalia | 1.6 /100 | #247 | Tragic $39,974 |
| Cape Verdeans | 1.5 /100 | #248 | Tragic $39,935 |