Cypriot vs Subsaharan African Householder Income Over 65 years

COMPARE

Cypriot
Race
Ancestry
AfghanAfricanAlaska NativeAlaskan AthabascanAlbanianAleutAlsatianAmericanApacheArabArapahoArgentineanArmenianAssyrian/Chaldean/SyriacAustralianAustrianBahamianBangladeshiBarbadianBasqueBelgianBelizeanBermudanBhutaneseBlackfeetBolivianBrazilianBritishBritish West IndianBulgarianBurmeseCajunCambodianCanadianCape VerdeanCarpatho RusynCelticCentral AmericanCentral American IndianCherokeeCheyenneChickasawChileanChineseChippewaChoctawColombianColvilleComancheCosta RicanCreeCreekCroatianCrowCubanCypriotCzechCzechoslovakianDanishDelawareDominicanDutchDutch West IndianEastern EuropeanEcuadorianEgyptianEnglishEstonianEthiopianEuropeanFijianFilipinoFinnishFrenchFrench American IndianFrench CanadianGermanGerman RussianGhanaianGreekGuamanian/ChamorroGuatemalanGuyaneseHaitianHmongHonduranHopiHoumaHungarianIcelanderIndian (Asian)IndonesianInupiatIranianIraqiIrishIroquoisIsraeliItalianJamaicanJapaneseJordanianKenyanKiowaKoreanLaotianLatvianLebaneseLiberianLithuanianLumbeeLuxembourgerMacedonianMalaysianMalteseMarshalleseMenomineeMexicanMexican American IndianMongolianMoroccanNative HawaiianNavajoNepaleseNew ZealanderNicaraguanNigerianNorthern EuropeanNorwegianOkinawanOsageOttawaPaiutePakistaniPalestinianPanamanianParaguayanPennsylvania GermanPeruvianPimaPolishPortuguesePotawatomiPuebloPuerto RicanPuget Sound SalishRomanianRussianSalvadoranSamoanScandinavianScotch-IrishScottishSeminoleSenegaleseSerbianShoshoneSierra LeoneanSiouxSlavicSlovakSloveneSomaliSouth AfricanSouth AmericanSouth American IndianSoviet UnionSpaniardSpanishSpanish AmericanSpanish American IndianSri LankanSudaneseSwedishSwissSyrianTaiwaneseThaiTlingit-HaidaTohono O'OdhamTonganTrinidadian and TobagonianTsimshianTurkishU.S. Virgin IslanderUgandanUkrainianUruguayanUteVenezuelanVietnameseWelshWest IndianYakamaYaquiYugoslavianYumanYup'ikZimbabwean
Immigration
NonimmigrantsImmigrantsAfghanistanAfricaAlbaniaArgentinaArmeniaAsiaAustraliaAustriaBahamasBangladeshBarbadosBelarusBelgiumBelizeBoliviaBosnia and HerzegovinaBrazilBulgariaBurma/MyanmarCabo VerdeCambodiaCameroonCanadaCaribbeanCentral AmericaChileChinaColombiaCongoCosta RicaCroatiaCubaCzechoslovakiaDenmarkDominicaDominican RepublicEastern AfricaEastern AsiaEastern EuropeEcuadorEgyptEl SalvadorEnglandEritreaEthiopiaEuropeFijiFranceGermanyGhanaGreeceGrenadaGuatemalaGuyanaHaitiHondurasHong KongHungaryIndiaIndonesiaIranIraqIrelandIsraelItalyJamaicaJapanJordanKazakhstanKenyaKoreaKuwaitLaosLatin AmericaLatviaLebanonLiberiaLithuaniaMalaysiaMexicoMicronesiaMiddle AfricaMoldovaMoroccoNepalNetherlandsNicaraguaNigeriaNorth AmericaNorth MacedoniaNorthern AfricaNorthern EuropeNorwayOceaniaPakistanPanamaPeruPhilippinesPolandPortugalRomaniaRussiaSaudi ArabiaScotlandSenegalSerbiaSierra LeoneSingaporeSomaliaSouth AfricaSouth AmericaSouth Central AsiaSouth Eastern AsiaSouthern EuropeSpainSri LankaSt. Vincent and the GrenadinesSudanSwedenSwitzerlandSyriaTaiwanThailandTrinidad and TobagoTurkeyUgandaUkraineUruguayUzbekistanVenezuelaVietnamWest IndiesWestern AfricaWestern AsiaWestern EuropeYemenZaireZimbabweAzores
Subsaharan African
Race
Ancestry
AfghanAfricanAlaska NativeAlaskan AthabascanAlbanianAleutAlsatianAmericanApacheArabArapahoArgentineanArmenianAssyrian/Chaldean/SyriacAustralianAustrianBahamianBangladeshiBarbadianBasqueBelgianBelizeanBermudanBhutaneseBlackfeetBolivianBrazilianBritishBritish West IndianBulgarianBurmeseCajunCambodianCanadianCape VerdeanCarpatho RusynCelticCentral AmericanCentral American IndianCherokeeCheyenneChickasawChileanChineseChippewaChoctawColombianColvilleComancheCosta RicanCreeCreekCroatianCrowCubanCzechCzechoslovakianDanishDelawareDominicanDutchDutch West IndianEastern EuropeanEcuadorianEgyptianEnglishEstonianEthiopianEuropeanFijianFilipinoFinnishFrenchFrench American IndianFrench CanadianGermanGerman RussianGhanaianGreekGuamanian/ChamorroGuatemalanGuyaneseHaitianHmongHonduranHopiHoumaHungarianIcelanderIndian (Asian)IndonesianInupiatIranianIraqiIrishIroquoisIsraeliItalianJamaicanJapaneseJordanianKenyanKiowaKoreanLaotianLatvianLebaneseLiberianLithuanianLumbeeLuxembourgerMacedonianMalaysianMalteseMarshalleseMenomineeMexicanMexican American IndianMongolianMoroccanNative HawaiianNavajoNepaleseNew ZealanderNicaraguanNigerianNorthern EuropeanNorwegianOkinawanOsageOttawaPaiutePakistaniPalestinianPanamanianParaguayanPennsylvania GermanPeruvianPimaPolishPortuguesePotawatomiPuebloPuerto RicanPuget Sound SalishRomanianRussianSalvadoranSamoanScandinavianScotch-IrishScottishSeminoleSenegaleseSerbianShoshoneSierra LeoneanSiouxSlavicSlovakSloveneSomaliSouth AfricanSouth AmericanSouth American IndianSoviet UnionSpaniardSpanishSpanish AmericanSpanish American IndianSri LankanSubsaharan AfricanSudaneseSwedishSwissSyrianTaiwaneseThaiTlingit-HaidaTohono O'OdhamTonganTrinidadian and TobagonianTsimshianTurkishU.S. Virgin IslanderUgandanUkrainianUruguayanUteVenezuelanVietnameseWelshWest IndianYakamaYaquiYugoslavianYumanYup'ikZimbabwean
Immigration
NonimmigrantsImmigrantsAfghanistanAfricaAlbaniaArgentinaArmeniaAsiaAustraliaAustriaBahamasBangladeshBarbadosBelarusBelgiumBelizeBoliviaBosnia and HerzegovinaBrazilBulgariaBurma/MyanmarCabo VerdeCambodiaCameroonCanadaCaribbeanCentral AmericaChileChinaColombiaCongoCosta RicaCroatiaCubaCzechoslovakiaDenmarkDominicaDominican RepublicEastern AfricaEastern AsiaEastern EuropeEcuadorEgyptEl SalvadorEnglandEritreaEthiopiaEuropeFijiFranceGermanyGhanaGreeceGrenadaGuatemalaGuyanaHaitiHondurasHong KongHungaryIndiaIndonesiaIranIraqIrelandIsraelItalyJamaicaJapanJordanKazakhstanKenyaKoreaKuwaitLaosLatin AmericaLatviaLebanonLiberiaLithuaniaMalaysiaMexicoMicronesiaMiddle AfricaMoldovaMoroccoNepalNetherlandsNicaraguaNigeriaNorth AmericaNorth MacedoniaNorthern AfricaNorthern EuropeNorwayOceaniaPakistanPanamaPeruPhilippinesPolandPortugalRomaniaRussiaSaudi ArabiaScotlandSenegalSerbiaSierra LeoneSingaporeSomaliaSouth AfricaSouth AmericaSouth Central AsiaSouth Eastern AsiaSouthern EuropeSpainSri LankaSt. Vincent and the GrenadinesSudanSwedenSwitzerlandSyriaTaiwanThailandTrinidad and TobagoTurkeyUgandaUkraineUruguayUzbekistanVenezuelaVietnamWest IndiesWestern AfricaWestern AsiaWestern EuropeYemenZaireZimbabweAzores
Householder Income Over 65 years
Income
Poverty
Unemployment
Labor Participation
Family Structure
Vehicle Availability
Education Level
Disability

Householder Income Over 65 years Comparison

Cypriots

Sub-Saharan Africans

Exceptional
Tragic
$71,714
HOUSEHOLDER INCOME OVER 65 YEARS
100.0/ 100
METRIC RATING
12th/ 347
METRIC RANK
$56,615
HOUSEHOLDER INCOME OVER 65 YEARS
1.0/ 100
METRIC RATING
240th/ 347
METRIC RANK

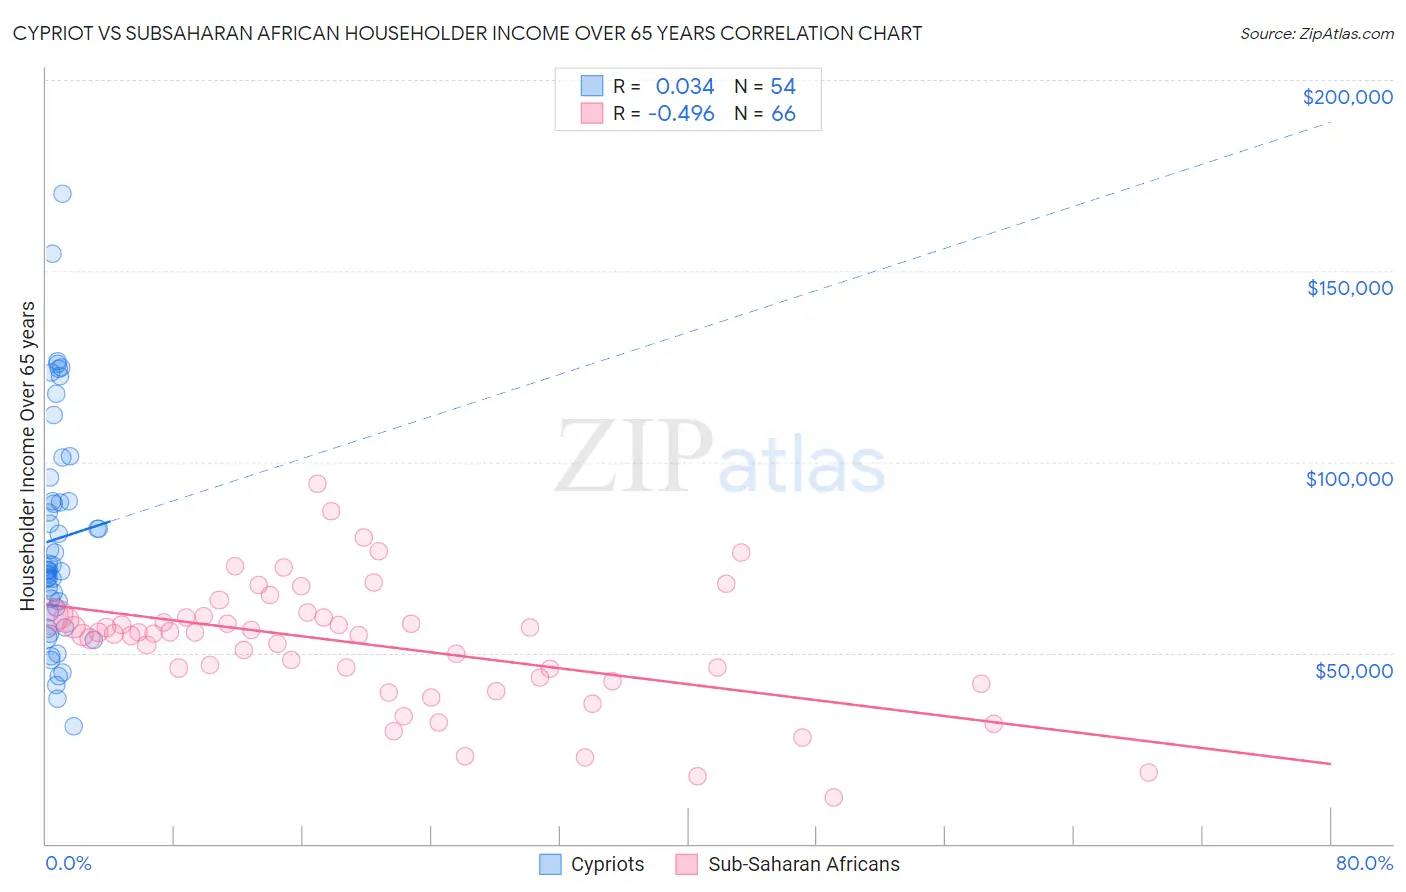
Cypriot vs Subsaharan African Householder Income Over 65 years Correlation Chart

The statistical analysis conducted on geographies consisting of 61,820,564 people shows no correlation between the proportion of Cypriots and household income with householder over the age of 65 in the United States with a correlation coefficient (R) of 0.034 and weighted average of $71,714. Similarly, the statistical analysis conducted on geographies consisting of 505,008,485 people shows a moderate negative correlation between the proportion of Sub-Saharan Africans and household income with householder over the age of 65 in the United States with a correlation coefficient (R) of -0.496 and weighted average of $56,615, a difference of 26.7%.
Cypriot vs Subsaharan African Householder Income Over 65 years

Householder Income Over 65 years Correlation Summary

MeasurementCypriotSubsaharan African
Minimum$30,872$12,049
Maximum$170,077$94,427
Range$139,205$82,378
Mean$79,873$52,341
Median$71,621$55,146
Interquartile 25% (IQ1)$60,572$43,507
Interquartile 75% (IQ3)$89,592$59,521
Interquartile Range (IQR)$29,021$16,014
Standard Deviation (Sample)$29,548$16,149
Standard Deviation (Population)$29,273$16,026

Similar Demographics by Householder Income Over 65 years

Demographics Similar to Cypriots by Householder Income Over 65 years

In terms of householder income over 65 years, the demographic groups most similar to Cypriots are Immigrants from Hong Kong ($71,567, a difference of 0.20%), Thai ($72,099, a difference of 0.54%), Bhutanese ($72,288, a difference of 0.80%), Burmese ($71,139, a difference of 0.81%), and Native Hawaiian ($71,021, a difference of 0.98%).
DemographicsRating | RankHouseholder Income Over 65 years
Immigrants | Iran
100.0
/100
|
#5
Exceptional
$75,081
Bolivians
100.0
/100
|
#6
Exceptional
$74,245
Immigrants | Bolivia
100.0
/100
|
#7
Exceptional
$73,434
Immigrants | Singapore
100.0
/100
|
#8
Exceptional
$72,963
Immigrants | India
100.0
/100
|
#9
Exceptional
$72,804
Bhutanese
100.0
/100
|
#10
Exceptional
$72,288
Thais
100.0
/100
|
#11
Exceptional
$72,099
Cypriots
100.0
/100
|
#12
Exceptional
$71,714
Immigrants | Hong Kong
100.0
/100
|
#13
Exceptional
$71,567
Burmese
100.0
/100
|
#14
Exceptional
$71,139
Native Hawaiians
100.0
/100
|
#15
Exceptional
$71,021
Okinawans
100.0
/100
|
#16
Exceptional
$70,846
Immigrants | Korea
100.0
/100
|
#17
Exceptional
$70,696
Eastern Europeans
100.0
/100
|
#18
Exceptional
$70,470
Indians (Asian)
100.0
/100
|
#19
Exceptional
$70,238

Demographics Similar to Sub-Saharan Africans by Householder Income Over 65 years

In terms of householder income over 65 years, the demographic groups most similar to Sub-Saharan Africans are Immigrants from Laos ($56,722, a difference of 0.19%), Immigrants from Guyana ($56,495, a difference of 0.21%), Fijian ($56,768, a difference of 0.27%), Yaqui ($56,417, a difference of 0.35%), and Guyanese ($56,351, a difference of 0.47%).
DemographicsRating | RankHouseholder Income Over 65 years
Immigrants | Western Africa
1.7
/100
|
#233
Tragic
$57,119
Immigrants | Burma/Myanmar
1.7
/100
|
#234
Tragic
$57,114
Spanish Americans
1.6
/100
|
#235
Tragic
$57,021
Immigrants | Uruguay
1.5
/100
|
#236
Tragic
$56,975
Immigrants | Panama
1.5
/100
|
#237
Tragic
$56,944
Fijians
1.2
/100
|
#238
Tragic
$56,768
Immigrants | Laos
1.2
/100
|
#239
Tragic
$56,722
Sub-Saharan Africans
1.0
/100
|
#240
Tragic
$56,615
Immigrants | Guyana
0.9
/100
|
#241
Tragic
$56,495
Yaqui
0.8
/100
|
#242
Tragic
$56,417
Guyanese
0.8
/100
|
#243
Tragic
$56,351
Hmong
0.8
/100
|
#244
Tragic
$56,339
Immigrants | Uzbekistan
0.8
/100
|
#245
Tragic
$56,331
Central Americans
0.8
/100
|
#246
Tragic
$56,321
Yakama
0.7
/100
|
#247
Tragic
$56,234