Cuban vs Immigrants from Hungary Median Male Earnings
COMPARE
Cuban
Immigrants from Hungary
Median Male Earnings
Median Male Earnings Comparison
Cubans
Immigrants from Hungary
$46,580
MEDIAN MALE EARNINGS
0.0/ 100
METRIC RATING
310th/ 347
METRIC RANK
$59,806
MEDIAN MALE EARNINGS
99.5/ 100
METRIC RATING
80th/ 347
METRIC RANK
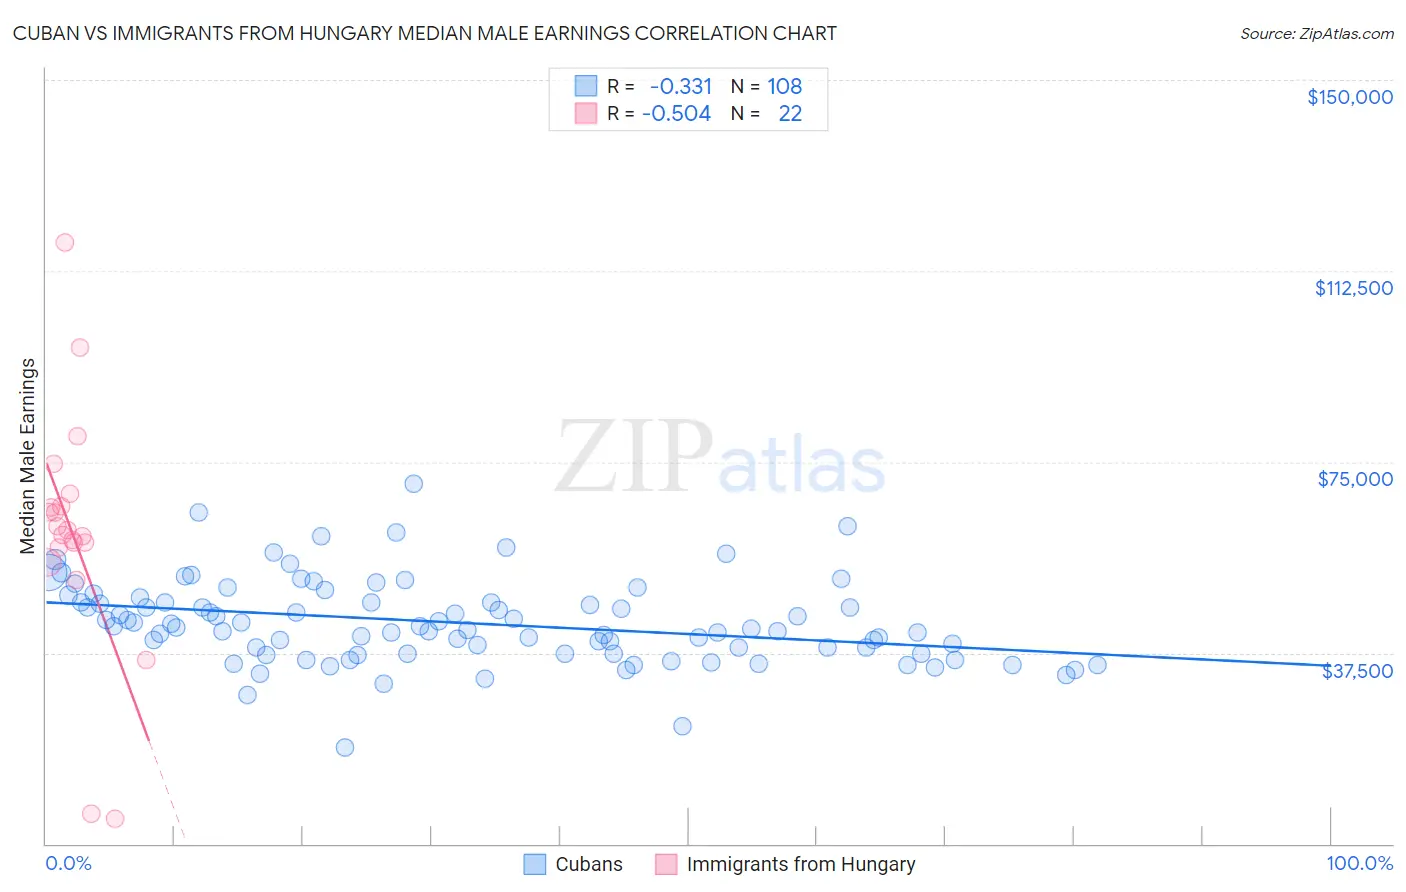
Cuban vs Immigrants from Hungary Median Male Earnings Correlation Chart
The statistical analysis conducted on geographies consisting of 449,183,844 people shows a mild negative correlation between the proportion of Cubans and median male earnings in the United States with a correlation coefficient (R) of -0.331 and weighted average of $46,580. Similarly, the statistical analysis conducted on geographies consisting of 195,676,338 people shows a substantial negative correlation between the proportion of Immigrants from Hungary and median male earnings in the United States with a correlation coefficient (R) of -0.504 and weighted average of $59,806, a difference of 28.4%.
Median Male Earnings Correlation Summary
| Measurement | Cuban | Immigrants from Hungary |
| Minimum | $18,938 | $4,861 |
| Maximum | $70,693 | $118,099 |
| Range | $51,755 | $113,238 |
| Mean | $43,444 | $60,734 |
| Median | $42,447 | $61,103 |
| Interquartile 25% (IQ1) | $37,372 | $58,200 |
| Interquartile 75% (IQ3) | $47,400 | $66,315 |
| Interquartile Range (IQR) | $10,028 | $8,115 |
| Standard Deviation (Sample) | $8,309 | $24,141 |
| Standard Deviation (Population) | $8,270 | $23,586 |
Similar Demographics by Median Male Earnings
Demographics Similar to Cubans by Median Male Earnings
In terms of median male earnings, the demographic groups most similar to Cubans are Creek ($46,594, a difference of 0.030%), Ottawa ($46,611, a difference of 0.070%), Dutch West Indian ($46,656, a difference of 0.16%), Immigrants from Dominican Republic ($46,655, a difference of 0.16%), and Apache ($46,429, a difference of 0.33%).
| Demographics | Rating | Rank | Median Male Earnings |
| Yaqui | 0.1 /100 | #303 | Tragic $46,777 |
| Bangladeshis | 0.1 /100 | #304 | Tragic $46,744 |
| Guatemalans | 0.0 /100 | #305 | Tragic $46,736 |
| Dutch West Indians | 0.0 /100 | #306 | Tragic $46,656 |
| Immigrants | Dominican Republic | 0.0 /100 | #307 | Tragic $46,655 |
| Ottawa | 0.0 /100 | #308 | Tragic $46,611 |
| Creek | 0.0 /100 | #309 | Tragic $46,594 |
| Cubans | 0.0 /100 | #310 | Tragic $46,580 |
| Apache | 0.0 /100 | #311 | Tragic $46,429 |
| Hispanics or Latinos | 0.0 /100 | #312 | Tragic $46,419 |
| Hondurans | 0.0 /100 | #313 | Tragic $46,374 |
| Chippewa | 0.0 /100 | #314 | Tragic $46,368 |
| Immigrants | Guatemala | 0.0 /100 | #315 | Tragic $46,244 |
| Immigrants | Caribbean | 0.0 /100 | #316 | Tragic $46,193 |
| Mexicans | 0.0 /100 | #317 | Tragic $46,147 |
Demographics Similar to Immigrants from Hungary by Median Male Earnings
In terms of median male earnings, the demographic groups most similar to Immigrants from Hungary are Immigrants from Ukraine ($59,820, a difference of 0.020%), Ukrainian ($59,728, a difference of 0.13%), Croatian ($59,715, a difference of 0.15%), Immigrants from Italy ($59,691, a difference of 0.19%), and Immigrants from Egypt ($59,925, a difference of 0.20%).
| Demographics | Rating | Rank | Median Male Earnings |
| Immigrants | North America | 99.7 /100 | #73 | Exceptional $60,265 |
| Argentineans | 99.6 /100 | #74 | Exceptional $60,117 |
| Immigrants | Bolivia | 99.6 /100 | #75 | Exceptional $60,088 |
| Romanians | 99.6 /100 | #76 | Exceptional $60,063 |
| Paraguayans | 99.5 /100 | #77 | Exceptional $59,975 |
| Immigrants | Egypt | 99.5 /100 | #78 | Exceptional $59,925 |
| Immigrants | Ukraine | 99.5 /100 | #79 | Exceptional $59,820 |
| Immigrants | Hungary | 99.5 /100 | #80 | Exceptional $59,806 |
| Ukrainians | 99.4 /100 | #81 | Exceptional $59,728 |
| Croatians | 99.4 /100 | #82 | Exceptional $59,715 |
| Immigrants | Italy | 99.4 /100 | #83 | Exceptional $59,691 |
| Afghans | 99.3 /100 | #84 | Exceptional $59,554 |
| Italians | 99.3 /100 | #85 | Exceptional $59,551 |
| Immigrants | England | 99.3 /100 | #86 | Exceptional $59,527 |
| Macedonians | 99.3 /100 | #87 | Exceptional $59,522 |