Cree vs Immigrants from the Azores Median Earnings
COMPARE
Cree
Immigrants from the Azores
Median Earnings
Median Earnings Comparison
Cree
Immigrants from the Azores
$42,777
MEDIAN EARNINGS
0.6/ 100
METRIC RATING
267th/ 347
METRIC RANK
$45,812
MEDIAN EARNINGS
29.5/ 100
METRIC RATING
200th/ 347
METRIC RANK
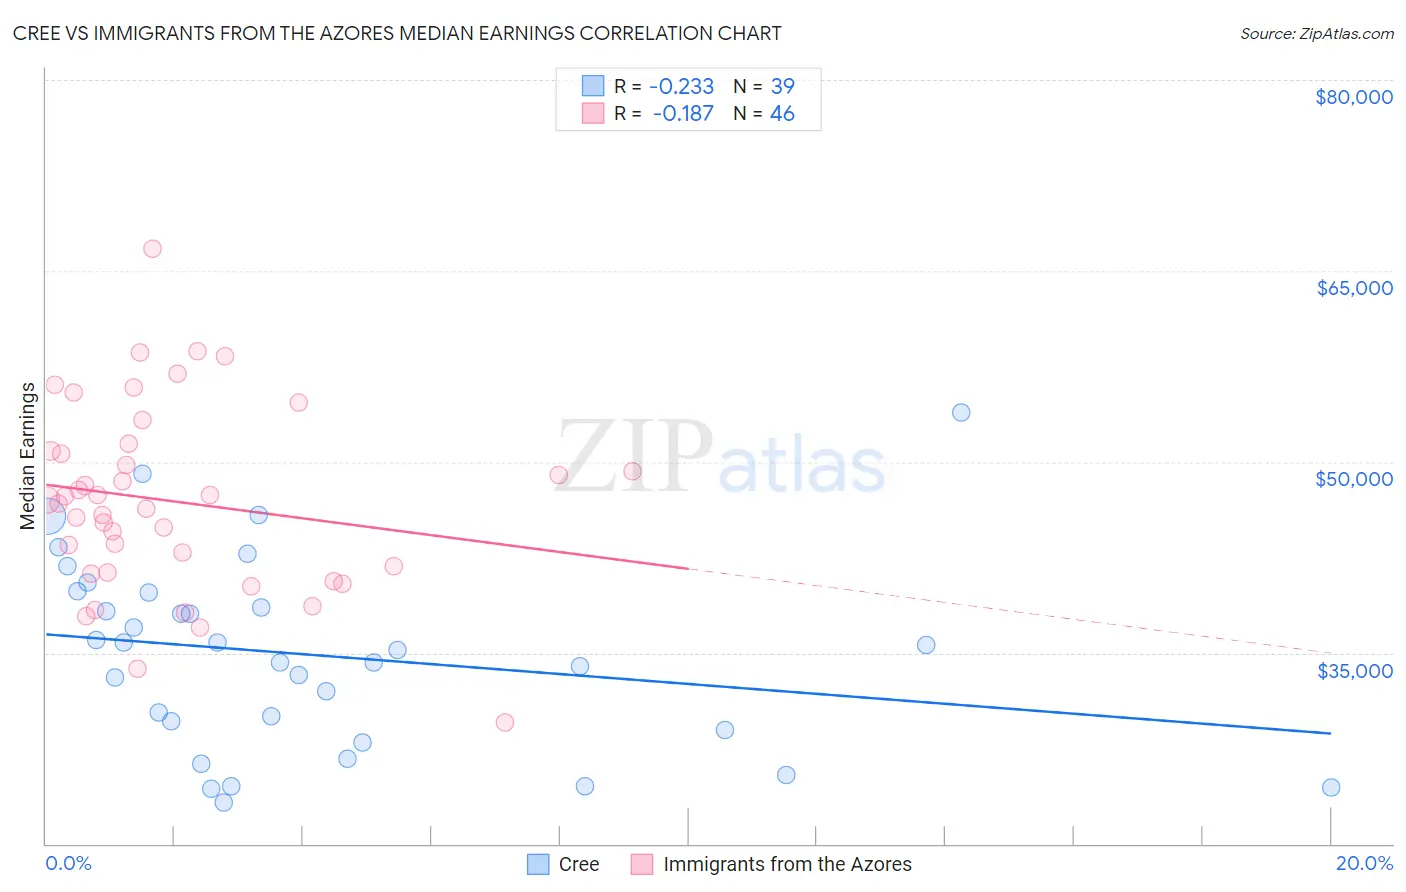
Cree vs Immigrants from the Azores Median Earnings Correlation Chart
The statistical analysis conducted on geographies consisting of 76,210,467 people shows a weak negative correlation between the proportion of Cree and median earnings in the United States with a correlation coefficient (R) of -0.233 and weighted average of $42,777. Similarly, the statistical analysis conducted on geographies consisting of 46,253,253 people shows a poor negative correlation between the proportion of Immigrants from the Azores and median earnings in the United States with a correlation coefficient (R) of -0.187 and weighted average of $45,812, a difference of 7.1%.
Median Earnings Correlation Summary
| Measurement | Cree | Immigrants from the Azores |
| Minimum | $23,200 | $29,500 |
| Maximum | $53,900 | $66,731 |
| Range | $30,700 | $37,231 |
| Mean | $34,814 | $46,892 |
| Median | $35,233 | $46,853 |
| Interquartile 25% (IQ1) | $28,896 | $41,350 |
| Interquartile 75% (IQ3) | $39,775 | $50,852 |
| Interquartile Range (IQR) | $10,879 | $9,501 |
| Standard Deviation (Sample) | $7,415 | $7,383 |
| Standard Deviation (Population) | $7,320 | $7,302 |
Similar Demographics by Median Earnings
Demographics Similar to Cree by Median Earnings
In terms of median earnings, the demographic groups most similar to Cree are American ($42,742, a difference of 0.080%), Belizean ($42,702, a difference of 0.17%), Immigrants from Laos ($42,884, a difference of 0.25%), Osage ($42,651, a difference of 0.29%), and Salvadoran ($42,912, a difference of 0.32%).
| Demographics | Rating | Rank | Median Earnings |
| Immigrants | Somalia | 0.9 /100 | #260 | Tragic $43,100 |
| Immigrants | Jamaica | 0.8 /100 | #261 | Tragic $43,026 |
| Nicaraguans | 0.8 /100 | #262 | Tragic $43,026 |
| Inupiat | 0.8 /100 | #263 | Tragic $43,000 |
| Immigrants | Liberia | 0.7 /100 | #264 | Tragic $42,923 |
| Salvadorans | 0.7 /100 | #265 | Tragic $42,912 |
| Immigrants | Laos | 0.7 /100 | #266 | Tragic $42,884 |
| Cree | 0.6 /100 | #267 | Tragic $42,777 |
| Americans | 0.6 /100 | #268 | Tragic $42,742 |
| Belizeans | 0.5 /100 | #269 | Tragic $42,702 |
| Osage | 0.5 /100 | #270 | Tragic $42,651 |
| Pennsylvania Germans | 0.5 /100 | #271 | Tragic $42,615 |
| Iroquois | 0.4 /100 | #272 | Tragic $42,430 |
| Immigrants | Dominica | 0.4 /100 | #273 | Tragic $42,420 |
| Immigrants | El Salvador | 0.4 /100 | #274 | Tragic $42,413 |
Demographics Similar to Immigrants from the Azores by Median Earnings
In terms of median earnings, the demographic groups most similar to Immigrants from the Azores are Immigrants from Barbados ($45,816, a difference of 0.010%), Trinidadian and Tobagonian ($45,820, a difference of 0.020%), Yugoslavian ($45,846, a difference of 0.070%), Barbadian ($45,846, a difference of 0.070%), and Celtic ($45,732, a difference of 0.18%).
| Demographics | Rating | Rank | Median Earnings |
| Guamanians/Chamorros | 33.2 /100 | #193 | Fair $45,933 |
| Immigrants | Costa Rica | 33.0 /100 | #194 | Fair $45,928 |
| Immigrants | St. Vincent and the Grenadines | 32.4 /100 | #195 | Fair $45,908 |
| Yugoslavians | 30.5 /100 | #196 | Fair $45,846 |
| Barbadians | 30.5 /100 | #197 | Fair $45,846 |
| Trinidadians and Tobagonians | 29.7 /100 | #198 | Fair $45,820 |
| Immigrants | Barbados | 29.6 /100 | #199 | Fair $45,816 |
| Immigrants | Azores | 29.5 /100 | #200 | Fair $45,812 |
| Celtics | 27.2 /100 | #201 | Fair $45,732 |
| Immigrants | Trinidad and Tobago | 27.1 /100 | #202 | Fair $45,729 |
| Welsh | 26.6 /100 | #203 | Fair $45,710 |
| Immigrants | Uruguay | 25.9 /100 | #204 | Fair $45,682 |
| Tongans | 25.4 /100 | #205 | Fair $45,665 |
| Immigrants | Ghana | 24.8 /100 | #206 | Fair $45,641 |
| Immigrants | Senegal | 24.0 /100 | #207 | Fair $45,611 |