Comanche vs Cherokee Householder Income Under 25 years
COMPARE
Comanche
Cherokee
Householder Income Under 25 years
Householder Income Under 25 years Comparison
Comanche
Cherokee
$47,518
HOUSEHOLDER INCOME UNDER 25 YEARS
0.0/ 100
METRIC RATING
308th/ 347
METRIC RANK
$47,848
HOUSEHOLDER INCOME UNDER 25 YEARS
0.0/ 100
METRIC RATING
305th/ 347
METRIC RANK
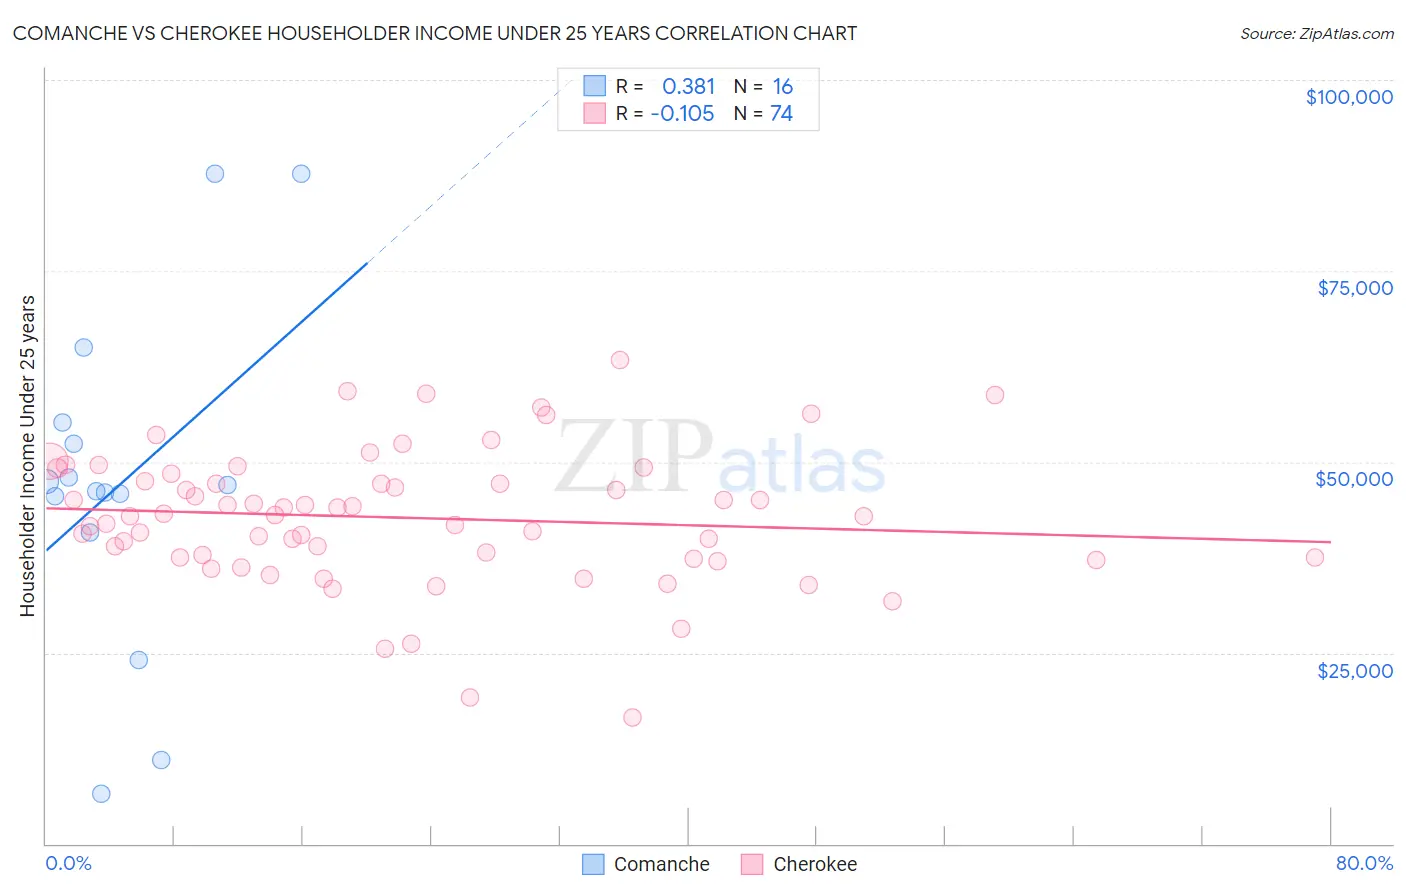
Comanche vs Cherokee Householder Income Under 25 years Correlation Chart
The statistical analysis conducted on geographies consisting of 103,551,593 people shows a mild positive correlation between the proportion of Comanche and household income with householder under the age of 25 in the United States with a correlation coefficient (R) of 0.381 and weighted average of $47,518. Similarly, the statistical analysis conducted on geographies consisting of 404,177,711 people shows a poor negative correlation between the proportion of Cherokee and household income with householder under the age of 25 in the United States with a correlation coefficient (R) of -0.105 and weighted average of $47,848, a difference of 0.69%.
Householder Income Under 25 years Correlation Summary
| Measurement | Comanche | Cherokee |
| Minimum | $6,484 | $16,563 |
| Maximum | $87,727 | $63,295 |
| Range | $81,243 | $46,732 |
| Mean | $47,234 | $42,680 |
| Median | $46,529 | $43,010 |
| Interquartile 25% (IQ1) | $43,131 | $37,476 |
| Interquartile 75% (IQ3) | $53,745 | $47,453 |
| Interquartile Range (IQR) | $10,614 | $9,977 |
| Standard Deviation (Sample) | $21,985 | $8,797 |
| Standard Deviation (Population) | $21,287 | $8,737 |
Demographics Similar to Comanche and Cherokee by Householder Income Under 25 years
In terms of householder income under 25 years, the demographic groups most similar to Comanche are Bangladeshi ($47,589, a difference of 0.15%), U.S. Virgin Islander ($47,448, a difference of 0.15%), Iroquois ($47,380, a difference of 0.29%), Ottawa ($47,366, a difference of 0.32%), and Bermudan ($47,359, a difference of 0.34%). Similarly, the demographic groups most similar to Cherokee are Menominee ($47,907, a difference of 0.12%), Immigrants from Middle Africa ($47,916, a difference of 0.14%), Immigrants from Liberia ($47,981, a difference of 0.28%), Native/Alaskan ($47,704, a difference of 0.30%), and Bangladeshi ($47,589, a difference of 0.55%).
| Demographics | Rating | Rank | Householder Income Under 25 years |
| Blackfeet | 0.0 /100 | #296 | Tragic $48,603 |
| Cree | 0.0 /100 | #297 | Tragic $48,514 |
| Yaqui | 0.0 /100 | #298 | Tragic $48,300 |
| Immigrants | Honduras | 0.0 /100 | #299 | Tragic $48,267 |
| Immigrants | Somalia | 0.0 /100 | #300 | Tragic $48,135 |
| Immigrants | Kuwait | 0.0 /100 | #301 | Tragic $48,126 |
| Immigrants | Liberia | 0.0 /100 | #302 | Tragic $47,981 |
| Immigrants | Middle Africa | 0.0 /100 | #303 | Tragic $47,916 |
| Menominee | 0.0 /100 | #304 | Tragic $47,907 |
| Cherokee | 0.0 /100 | #305 | Tragic $47,848 |
| Natives/Alaskans | 0.0 /100 | #306 | Tragic $47,704 |
| Bangladeshis | 0.0 /100 | #307 | Tragic $47,589 |
| Comanche | 0.0 /100 | #308 | Tragic $47,518 |
| U.S. Virgin Islanders | 0.0 /100 | #309 | Tragic $47,448 |
| Iroquois | 0.0 /100 | #310 | Tragic $47,380 |
| Ottawa | 0.0 /100 | #311 | Tragic $47,366 |
| Bermudans | 0.0 /100 | #312 | Tragic $47,359 |
| Delaware | 0.0 /100 | #313 | Tragic $47,159 |
| Chippewa | 0.0 /100 | #314 | Tragic $47,015 |
| Crow | 0.0 /100 | #315 | Tragic $47,012 |
| Sudanese | 0.0 /100 | #316 | Tragic $46,982 |