Colombian vs Kiowa Per Capita Income
COMPARE
Colombian
Kiowa
Per Capita Income
Per Capita Income Comparison
Colombians
Kiowa
$43,661
PER CAPITA INCOME
50.0/ 100
METRIC RATING
174th/ 347
METRIC RANK
$35,102
PER CAPITA INCOME
0.0/ 100
METRIC RATING
324th/ 347
METRIC RANK
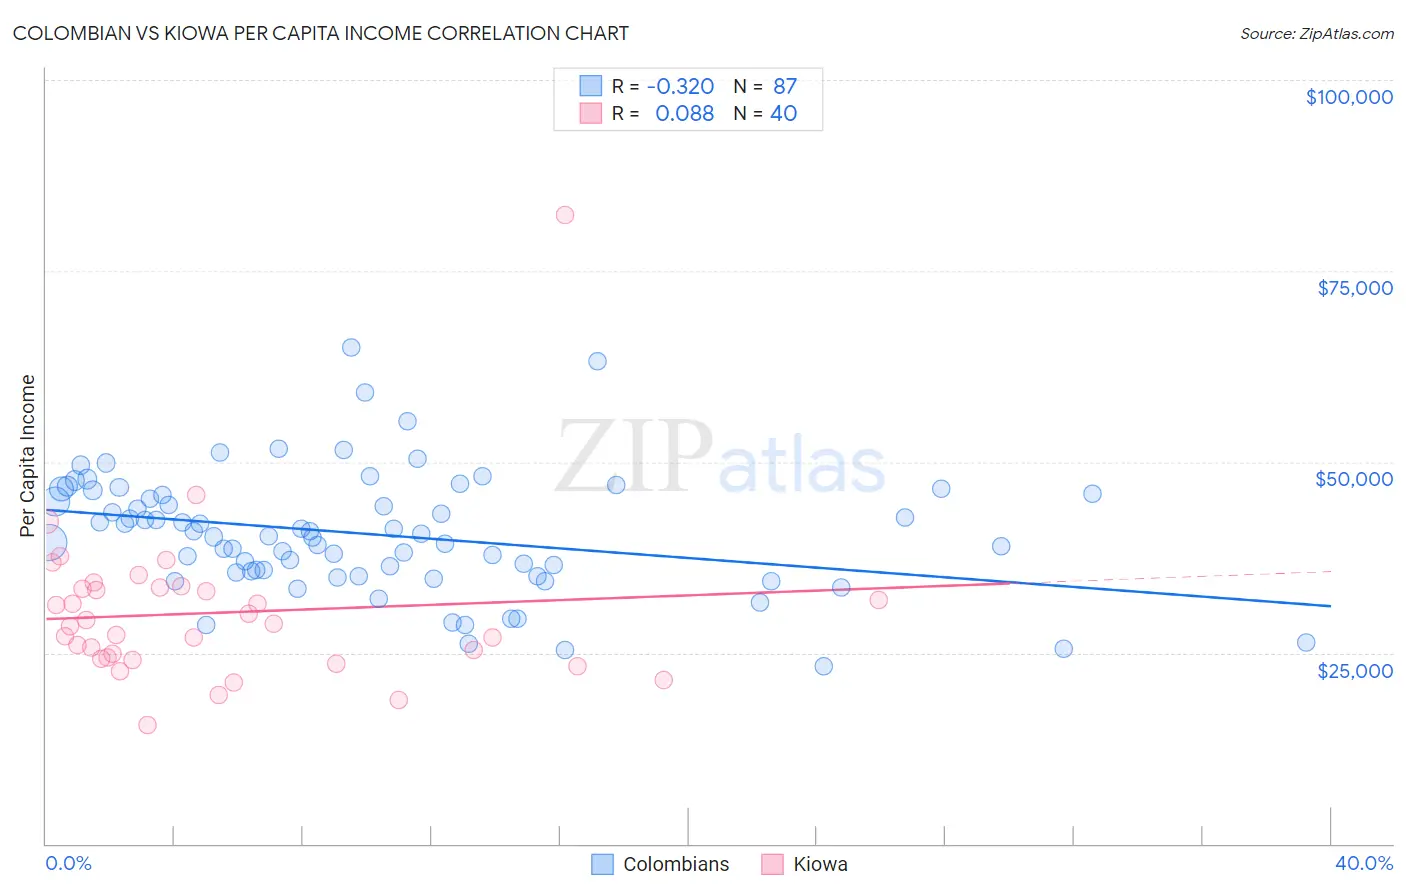
Colombian vs Kiowa Per Capita Income Correlation Chart
The statistical analysis conducted on geographies consisting of 419,718,902 people shows a mild negative correlation between the proportion of Colombians and per capita income in the United States with a correlation coefficient (R) of -0.320 and weighted average of $43,661. Similarly, the statistical analysis conducted on geographies consisting of 56,101,664 people shows a slight positive correlation between the proportion of Kiowa and per capita income in the United States with a correlation coefficient (R) of 0.088 and weighted average of $35,102, a difference of 24.4%.
Per Capita Income Correlation Summary
| Measurement | Colombian | Kiowa |
| Minimum | $23,272 | $15,468 |
| Maximum | $65,011 | $82,387 |
| Range | $41,739 | $66,919 |
| Mean | $40,509 | $30,249 |
| Median | $40,249 | $28,572 |
| Interquartile 25% (IQ1) | $35,498 | $24,302 |
| Interquartile 75% (IQ3) | $45,774 | $33,441 |
| Interquartile Range (IQR) | $10,276 | $9,140 |
| Standard Deviation (Sample) | $7,993 | $10,578 |
| Standard Deviation (Population) | $7,947 | $10,445 |
Similar Demographics by Per Capita Income
Demographics Similar to Colombians by Per Capita Income
In terms of per capita income, the demographic groups most similar to Colombians are French ($43,685, a difference of 0.060%), Celtic ($43,621, a difference of 0.090%), Immigrants from South Eastern Asia ($43,539, a difference of 0.28%), Czechoslovakian ($43,806, a difference of 0.33%), and Tlingit-Haida ($43,516, a difference of 0.33%).
| Demographics | Rating | Rank | Per Capita Income |
| English | 58.9 /100 | #167 | Average $43,982 |
| Belgians | 58.1 /100 | #168 | Average $43,951 |
| Immigrants | Peru | 55.3 /100 | #169 | Average $43,852 |
| Scandinavians | 55.2 /100 | #170 | Average $43,848 |
| Immigrants | Eastern Africa | 54.9 /100 | #171 | Average $43,838 |
| Czechoslovakians | 54.1 /100 | #172 | Average $43,806 |
| French | 50.7 /100 | #173 | Average $43,685 |
| Colombians | 50.0 /100 | #174 | Average $43,661 |
| Celtics | 48.9 /100 | #175 | Average $43,621 |
| Immigrants | South Eastern Asia | 46.6 /100 | #176 | Average $43,539 |
| Tlingit-Haida | 45.9 /100 | #177 | Average $43,516 |
| Immigrants | Costa Rica | 44.5 /100 | #178 | Average $43,464 |
| Finns | 44.4 /100 | #179 | Average $43,461 |
| Sierra Leoneans | 42.9 /100 | #180 | Average $43,405 |
| Welsh | 38.2 /100 | #181 | Fair $43,233 |
Demographics Similar to Kiowa by Per Capita Income
In terms of per capita income, the demographic groups most similar to Kiowa are Immigrants from Central America ($34,974, a difference of 0.37%), Cheyenne ($35,276, a difference of 0.50%), Immigrants from Cuba ($34,910, a difference of 0.55%), Apache ($34,886, a difference of 0.62%), and Creek ($35,546, a difference of 1.3%).
| Demographics | Rating | Rank | Per Capita Income |
| Dutch West Indians | 0.0 /100 | #317 | Tragic $35,922 |
| Bangladeshis | 0.0 /100 | #318 | Tragic $35,897 |
| Immigrants | Congo | 0.0 /100 | #319 | Tragic $35,720 |
| Hispanics or Latinos | 0.0 /100 | #320 | Tragic $35,688 |
| Blacks/African Americans | 0.0 /100 | #321 | Tragic $35,564 |
| Creek | 0.0 /100 | #322 | Tragic $35,546 |
| Cheyenne | 0.0 /100 | #323 | Tragic $35,276 |
| Kiowa | 0.0 /100 | #324 | Tragic $35,102 |
| Immigrants | Central America | 0.0 /100 | #325 | Tragic $34,974 |
| Immigrants | Cuba | 0.0 /100 | #326 | Tragic $34,910 |
| Apache | 0.0 /100 | #327 | Tragic $34,886 |
| Menominee | 0.0 /100 | #328 | Tragic $34,578 |
| Mexicans | 0.0 /100 | #329 | Tragic $34,559 |
| Spanish American Indians | 0.0 /100 | #330 | Tragic $34,195 |
| Immigrants | Mexico | 0.0 /100 | #331 | Tragic $33,931 |