Chinese vs Delaware Per Capita Income
COMPARE
Chinese
Delaware
Per Capita Income
Per Capita Income Comparison
Chinese
Delaware
$46,098
PER CAPITA INCOME
93.9/ 100
METRIC RATING
117th/ 347
METRIC RANK
$40,778
PER CAPITA INCOME
3.8/ 100
METRIC RATING
233rd/ 347
METRIC RANK
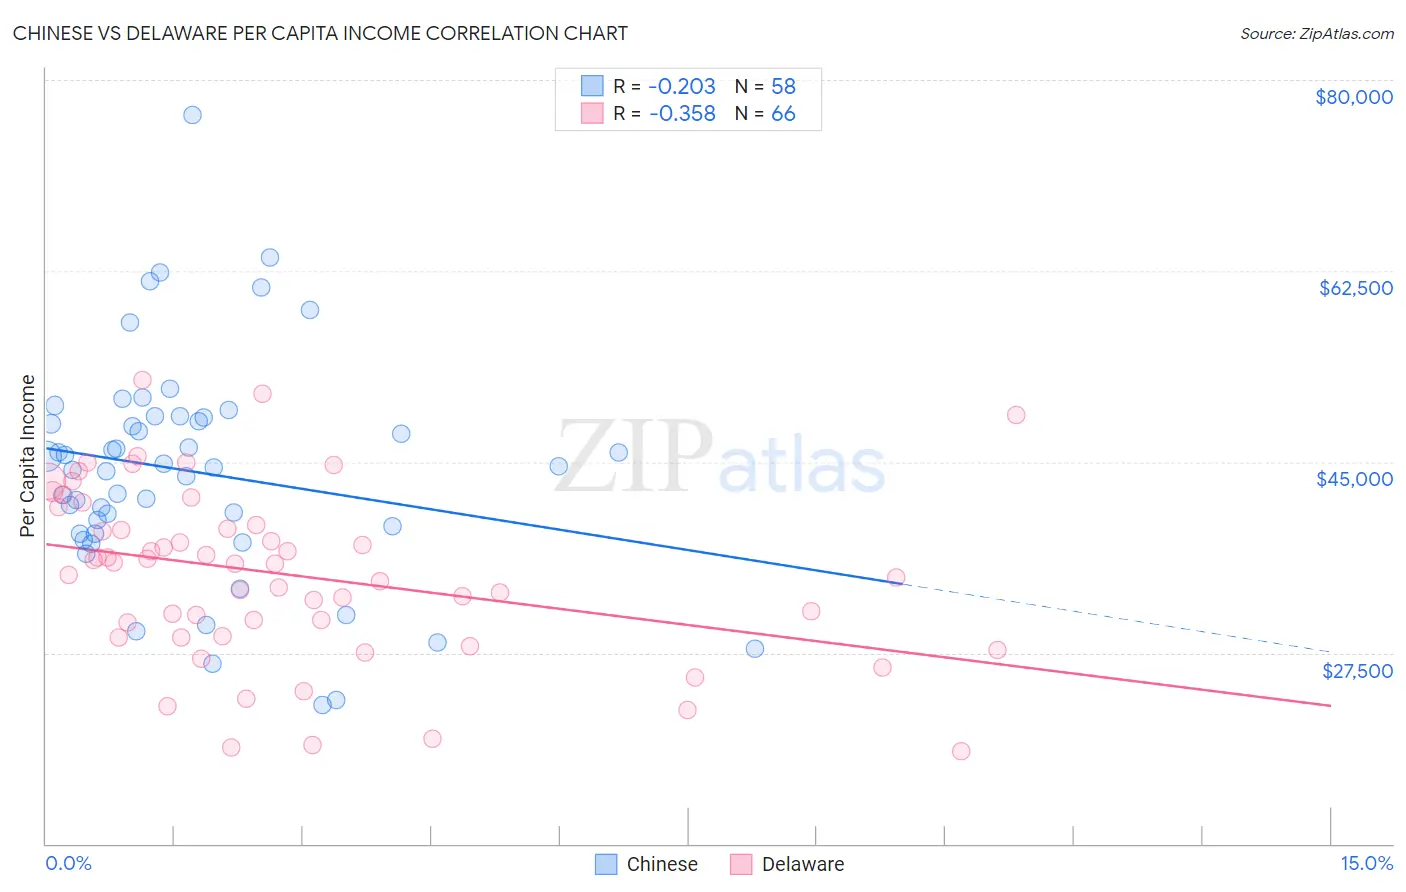
Chinese vs Delaware Per Capita Income Correlation Chart
The statistical analysis conducted on geographies consisting of 64,809,125 people shows a weak negative correlation between the proportion of Chinese and per capita income in the United States with a correlation coefficient (R) of -0.203 and weighted average of $46,098. Similarly, the statistical analysis conducted on geographies consisting of 96,239,490 people shows a mild negative correlation between the proportion of Delaware and per capita income in the United States with a correlation coefficient (R) of -0.358 and weighted average of $40,778, a difference of 13.1%.
Per Capita Income Correlation Summary
| Measurement | Chinese | Delaware |
| Minimum | $22,765 | $18,507 |
| Maximum | $76,789 | $52,470 |
| Range | $54,024 | $33,963 |
| Mean | $44,105 | $34,628 |
| Median | $44,514 | $35,673 |
| Interquartile 25% (IQ1) | $38,432 | $29,044 |
| Interquartile 75% (IQ3) | $49,089 | $39,167 |
| Interquartile Range (IQR) | $10,657 | $10,124 |
| Standard Deviation (Sample) | $10,226 | $7,889 |
| Standard Deviation (Population) | $10,137 | $7,829 |
Similar Demographics by Per Capita Income
Demographics Similar to Chinese by Per Capita Income
In terms of per capita income, the demographic groups most similar to Chinese are Polish ($46,123, a difference of 0.050%), Immigrants from Saudi Arabia ($46,008, a difference of 0.19%), Immigrants from Chile ($46,213, a difference of 0.25%), Immigrants from Poland ($45,979, a difference of 0.26%), and Afghan ($46,268, a difference of 0.37%).
| Demographics | Rating | Rank | Per Capita Income |
| Chileans | 95.9 /100 | #110 | Exceptional $46,459 |
| Taiwanese | 95.8 /100 | #111 | Exceptional $46,455 |
| Immigrants | Morocco | 95.7 /100 | #112 | Exceptional $46,430 |
| Immigrants | Albania | 95.5 /100 | #113 | Exceptional $46,387 |
| Afghans | 94.9 /100 | #114 | Exceptional $46,268 |
| Immigrants | Chile | 94.6 /100 | #115 | Exceptional $46,213 |
| Poles | 94.1 /100 | #116 | Exceptional $46,123 |
| Chinese | 93.9 /100 | #117 | Exceptional $46,098 |
| Immigrants | Saudi Arabia | 93.3 /100 | #118 | Exceptional $46,008 |
| Immigrants | Poland | 93.1 /100 | #119 | Exceptional $45,979 |
| Immigrants | Ethiopia | 92.7 /100 | #120 | Exceptional $45,923 |
| Canadians | 92.2 /100 | #121 | Exceptional $45,858 |
| Moroccans | 92.1 /100 | #122 | Exceptional $45,854 |
| Lebanese | 92.0 /100 | #123 | Exceptional $45,840 |
| Europeans | 92.0 /100 | #124 | Exceptional $45,836 |
Demographics Similar to Delaware by Per Capita Income
In terms of per capita income, the demographic groups most similar to Delaware are Immigrants from West Indies ($40,763, a difference of 0.040%), Immigrants from Guyana ($40,742, a difference of 0.090%), Nonimmigrants ($40,669, a difference of 0.27%), Guyanese ($40,949, a difference of 0.42%), and Senegalese ($41,000, a difference of 0.55%).
| Demographics | Rating | Rank | Per Capita Income |
| Immigrants | Ecuador | 5.9 /100 | #226 | Tragic $41,195 |
| Immigrants | Ghana | 5.5 /100 | #227 | Tragic $41,131 |
| Immigrants | Grenada | 5.5 /100 | #228 | Tragic $41,123 |
| Nigerians | 4.9 /100 | #229 | Tragic $41,026 |
| Native Hawaiians | 4.9 /100 | #230 | Tragic $41,017 |
| Senegalese | 4.8 /100 | #231 | Tragic $41,000 |
| Guyanese | 4.5 /100 | #232 | Tragic $40,949 |
| Delaware | 3.8 /100 | #233 | Tragic $40,778 |
| Immigrants | West Indies | 3.7 /100 | #234 | Tragic $40,763 |
| Immigrants | Guyana | 3.6 /100 | #235 | Tragic $40,742 |
| Immigrants | Nonimmigrants | 3.4 /100 | #236 | Tragic $40,669 |
| Immigrants | Cambodia | 2.6 /100 | #237 | Tragic $40,434 |
| Somalis | 2.4 /100 | #238 | Tragic $40,367 |
| Tsimshian | 2.4 /100 | #239 | Tragic $40,344 |
| Immigrants | Nigeria | 2.3 /100 | #240 | Tragic $40,339 |