Chilean vs Immigrants from Latin America Median Family Income

COMPARE

Chilean
Race
Ancestry
AfghanAfricanAlaska NativeAlaskan AthabascanAlbanianAleutAlsatianAmericanApacheArabArapahoArgentineanArmenianAssyrian/Chaldean/SyriacAustralianAustrianBahamianBangladeshiBarbadianBasqueBelgianBelizeanBermudanBhutaneseBlackfeetBolivianBrazilianBritishBritish West IndianBulgarianBurmeseCajunCambodianCanadianCape VerdeanCarpatho RusynCelticCentral AmericanCentral American IndianCherokeeCheyenneChickasawChileanChineseChippewaChoctawColombianColvilleComancheCosta RicanCreeCreekCroatianCrowCubanCypriotCzechCzechoslovakianDanishDelawareDominicanDutchDutch West IndianEastern EuropeanEcuadorianEgyptianEnglishEstonianEthiopianEuropeanFijianFilipinoFinnishFrenchFrench American IndianFrench CanadianGermanGerman RussianGhanaianGreekGuamanian/ChamorroGuatemalanGuyaneseHaitianHmongHonduranHopiHoumaHungarianIcelanderIndian (Asian)IndonesianInupiatIranianIraqiIrishIroquoisIsraeliItalianJamaicanJapaneseJordanianKenyanKiowaKoreanLaotianLatvianLebaneseLiberianLithuanianLumbeeLuxembourgerMacedonianMalaysianMalteseMarshalleseMenomineeMexicanMexican American IndianMongolianMoroccanNative HawaiianNavajoNepaleseNew ZealanderNicaraguanNigerianNorthern EuropeanNorwegianOkinawanOsageOttawaPaiutePakistaniPalestinianPanamanianParaguayanPennsylvania GermanPeruvianPimaPolishPortuguesePotawatomiPuebloPuerto RicanPuget Sound SalishRomanianRussianSalvadoranSamoanScandinavianScotch-IrishScottishSeminoleSenegaleseSerbianShoshoneSierra LeoneanSiouxSlavicSlovakSloveneSomaliSouth AfricanSouth AmericanSouth American IndianSoviet UnionSpaniardSpanishSpanish AmericanSpanish American IndianSri LankanSubsaharan AfricanSudaneseSwedishSwissSyrianTaiwaneseThaiTlingit-HaidaTohono O'OdhamTonganTrinidadian and TobagonianTsimshianTurkishU.S. Virgin IslanderUgandanUkrainianUruguayanUteVenezuelanVietnameseWelshWest IndianYakamaYaquiYugoslavianYumanYup'ikZimbabwean
Immigration
NonimmigrantsImmigrantsAfghanistanAfricaAlbaniaArgentinaArmeniaAsiaAustraliaAustriaBahamasBangladeshBarbadosBelarusBelgiumBelizeBoliviaBosnia and HerzegovinaBrazilBulgariaBurma/MyanmarCabo VerdeCambodiaCameroonCanadaCaribbeanCentral AmericaChileChinaColombiaCongoCosta RicaCroatiaCubaCzechoslovakiaDenmarkDominicaDominican RepublicEastern AfricaEastern AsiaEastern EuropeEcuadorEgyptEl SalvadorEnglandEritreaEthiopiaEuropeFijiFranceGermanyGhanaGreeceGrenadaGuatemalaGuyanaHaitiHondurasHong KongHungaryIndiaIndonesiaIranIraqIrelandIsraelItalyJamaicaJapanJordanKazakhstanKenyaKoreaKuwaitLaosLatviaLebanonLiberiaLithuaniaMalaysiaMexicoMicronesiaMiddle AfricaMoldovaMoroccoNepalNetherlandsNicaraguaNigeriaNorth AmericaNorth MacedoniaNorthern AfricaNorthern EuropeNorwayOceaniaPakistanPanamaPeruPhilippinesPolandPortugalRomaniaRussiaSaudi ArabiaScotlandSenegalSerbiaSierra LeoneSingaporeSomaliaSouth AfricaSouth AmericaSouth Central AsiaSouth Eastern AsiaSouthern EuropeSpainSri LankaSt. Vincent and the GrenadinesSudanSwedenSwitzerlandSyriaTaiwanThailandTrinidad and TobagoTurkeyUgandaUkraineUruguayUzbekistanVenezuelaVietnamWest IndiesWestern AfricaWestern AsiaWestern EuropeYemenZaireZimbabweAzores
Immigrants from Latin America
Race
Ancestry
AfghanAfricanAlaska NativeAlaskan AthabascanAlbanianAleutAlsatianAmericanApacheArabArapahoArgentineanArmenianAssyrian/Chaldean/SyriacAustralianAustrianBahamianBangladeshiBarbadianBasqueBelgianBelizeanBermudanBhutaneseBlackfeetBolivianBrazilianBritishBritish West IndianBulgarianBurmeseCajunCambodianCanadianCape VerdeanCarpatho RusynCelticCentral AmericanCentral American IndianCherokeeCheyenneChickasawChineseChippewaChoctawColombianColvilleComancheCosta RicanCreeCreekCroatianCrowCubanCypriotCzechCzechoslovakianDanishDelawareDominicanDutchDutch West IndianEastern EuropeanEcuadorianEgyptianEnglishEstonianEthiopianEuropeanFijianFilipinoFinnishFrenchFrench American IndianFrench CanadianGermanGerman RussianGhanaianGreekGuamanian/ChamorroGuatemalanGuyaneseHaitianHmongHonduranHopiHoumaHungarianIcelanderIndian (Asian)IndonesianInupiatIranianIraqiIrishIroquoisIsraeliItalianJamaicanJapaneseJordanianKenyanKiowaKoreanLaotianLatvianLebaneseLiberianLithuanianLumbeeLuxembourgerMacedonianMalaysianMalteseMarshalleseMenomineeMexicanMexican American IndianMongolianMoroccanNative HawaiianNavajoNepaleseNew ZealanderNicaraguanNigerianNorthern EuropeanNorwegianOkinawanOsageOttawaPaiutePakistaniPalestinianPanamanianParaguayanPennsylvania GermanPeruvianPimaPolishPortuguesePotawatomiPuebloPuerto RicanPuget Sound SalishRomanianRussianSalvadoranSamoanScandinavianScotch-IrishScottishSeminoleSenegaleseSerbianShoshoneSierra LeoneanSiouxSlavicSlovakSloveneSomaliSouth AfricanSouth AmericanSouth American IndianSoviet UnionSpaniardSpanishSpanish AmericanSpanish American IndianSri LankanSubsaharan AfricanSudaneseSwedishSwissSyrianTaiwaneseThaiTlingit-HaidaTohono O'OdhamTonganTrinidadian and TobagonianTsimshianTurkishU.S. Virgin IslanderUgandanUkrainianUruguayanUteVenezuelanVietnameseWelshWest IndianYakamaYaquiYugoslavianYumanYup'ikZimbabwean
Immigration
NonimmigrantsImmigrantsAfghanistanAfricaAlbaniaArgentinaArmeniaAsiaAustraliaAustriaBahamasBangladeshBarbadosBelarusBelgiumBelizeBoliviaBosnia and HerzegovinaBrazilBulgariaBurma/MyanmarCabo VerdeCambodiaCameroonCanadaCaribbeanCentral AmericaChileChinaColombiaCongoCosta RicaCroatiaCubaCzechoslovakiaDenmarkDominicaDominican RepublicEastern AfricaEastern AsiaEastern EuropeEcuadorEgyptEl SalvadorEnglandEritreaEthiopiaEuropeFijiFranceGermanyGhanaGreeceGrenadaGuatemalaGuyanaHaitiHondurasHong KongHungaryIndiaIndonesiaIranIraqIrelandIsraelItalyJamaicaJapanJordanKazakhstanKenyaKoreaKuwaitLaosLatin AmericaLatviaLebanonLiberiaLithuaniaMalaysiaMexicoMicronesiaMiddle AfricaMoldovaMoroccoNepalNetherlandsNicaraguaNigeriaNorth AmericaNorth MacedoniaNorthern AfricaNorthern EuropeNorwayOceaniaPakistanPanamaPeruPhilippinesPolandPortugalRomaniaRussiaSaudi ArabiaScotlandSenegalSerbiaSierra LeoneSingaporeSomaliaSouth AfricaSouth AmericaSouth Central AsiaSouth Eastern AsiaSouthern EuropeSpainSri LankaSt. Vincent and the GrenadinesSudanSwedenSwitzerlandSyriaTaiwanThailandTrinidad and TobagoTurkeyUgandaUkraineUruguayUzbekistanVenezuelaVietnamWest IndiesWestern AfricaWestern AsiaWestern EuropeYemenZaireZimbabweAzores
Median Family Income
Income
Poverty
Unemployment
Labor Participation
Family Structure
Vehicle Availability
Education Level
Disability

Median Family Income Comparison

Chileans

Immigrants from Latin America

Exceptional
Tragic
$108,429
MEDIAN FAMILY INCOME
95.0/ 100
METRIC RATING
116th/ 347
METRIC RANK
$86,989
MEDIAN FAMILY INCOME
0.0/ 100
METRIC RATING
298th/ 347
METRIC RANK

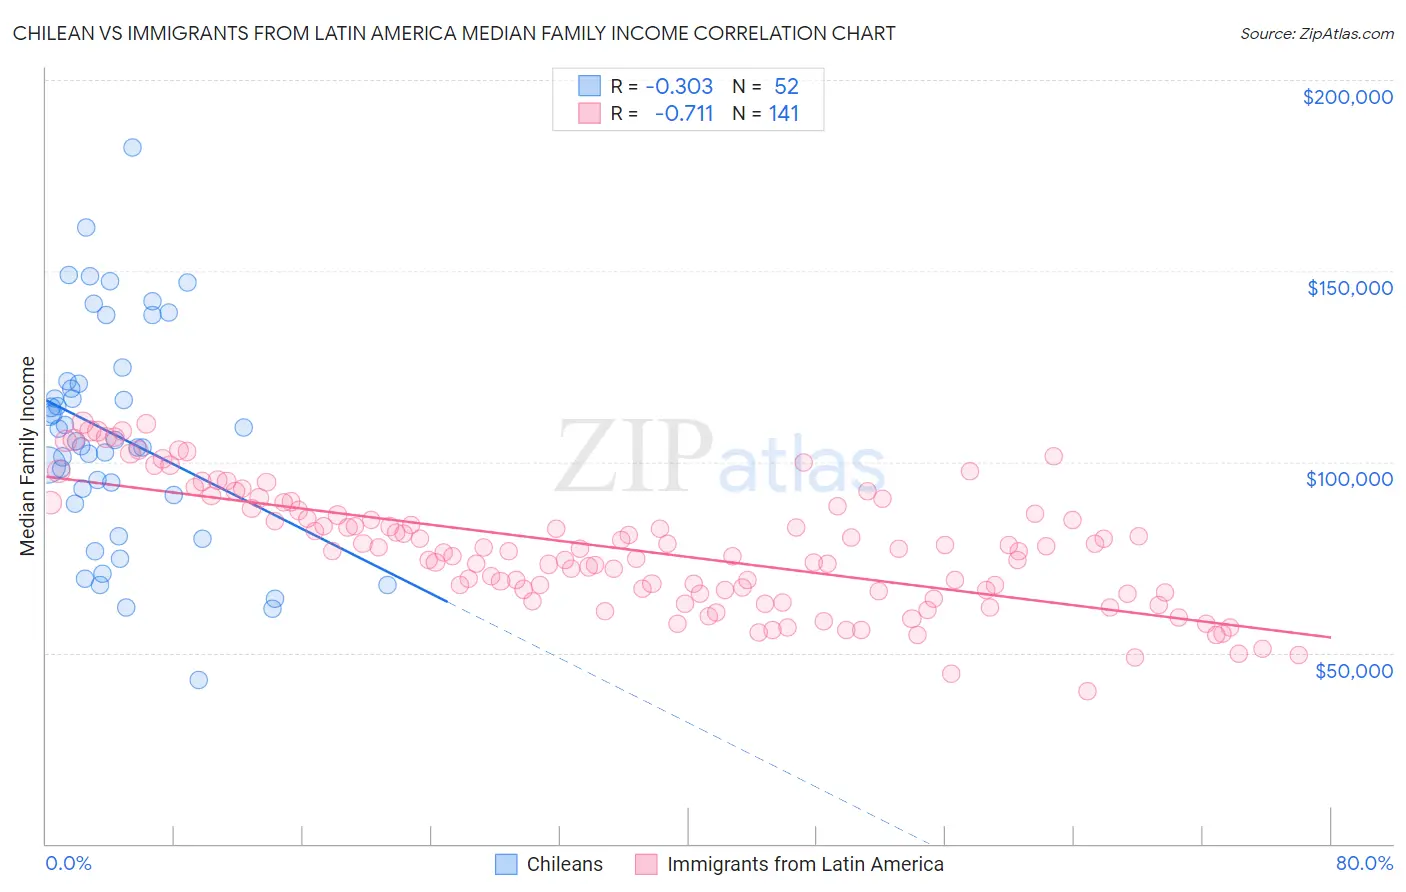
Chilean vs Immigrants from Latin America Median Family Income Correlation Chart

The statistical analysis conducted on geographies consisting of 256,482,123 people shows a mild negative correlation between the proportion of Chileans and median family income in the United States with a correlation coefficient (R) of -0.303 and weighted average of $108,429. Similarly, the statistical analysis conducted on geographies consisting of 557,337,898 people shows a strong negative correlation between the proportion of Immigrants from Latin America and median family income in the United States with a correlation coefficient (R) of -0.711 and weighted average of $86,989, a difference of 24.6%.
Chilean vs Immigrants from Latin America Median Family Income

Median Family Income Correlation Summary

MeasurementChileanImmigrants from Latin America
Minimum$42,833$39,785
Maximum$182,212$110,302
Range$139,379$70,517
Mean$106,873$77,259
Median$105,526$76,749
Interquartile 25% (IQ1)$90,247$66,005
Interquartile 75% (IQ3)$120,874$88,129
Interquartile Range (IQR)$30,627$22,124
Standard Deviation (Sample)$28,929$15,813
Standard Deviation (Population)$28,649$15,756

Similar Demographics by Median Family Income

Demographics Similar to Chileans by Median Family Income

In terms of median family income, the demographic groups most similar to Chileans are Swedish ($108,499, a difference of 0.060%), Polish ($108,507, a difference of 0.070%), Immigrants from Saudi Arabia ($108,544, a difference of 0.11%), Immigrants from Poland ($108,570, a difference of 0.13%), and Immigrants from Philippines ($108,288, a difference of 0.13%).
DemographicsRating | RankMedian Family Income
Immigrants | Afghanistan
95.6
/100
|
#109
Exceptional
$108,709
British
95.6
/100
|
#110
Exceptional
$108,705
Immigrants | Western Asia
95.6
/100
|
#111
Exceptional
$108,691
Immigrants | Poland
95.3
/100
|
#112
Exceptional
$108,570
Immigrants | Saudi Arabia
95.2
/100
|
#113
Exceptional
$108,544
Poles
95.2
/100
|
#114
Exceptional
$108,507
Swedes
95.1
/100
|
#115
Exceptional
$108,499
Chileans
95.0
/100
|
#116
Exceptional
$108,429
Immigrants | Philippines
94.6
/100
|
#117
Exceptional
$108,288
Ethiopians
94.5
/100
|
#118
Exceptional
$108,251
Sri Lankans
94.5
/100
|
#119
Exceptional
$108,234
Immigrants | Northern Africa
94.3
/100
|
#120
Exceptional
$108,161
Europeans
94.1
/100
|
#121
Exceptional
$108,099
Immigrants | Jordan
92.9
/100
|
#122
Exceptional
$107,715
Carpatho Rusyns
92.2
/100
|
#123
Exceptional
$107,502

Demographics Similar to Immigrants from Latin America by Median Family Income

In terms of median family income, the demographic groups most similar to Immigrants from Latin America are Chippewa ($86,852, a difference of 0.16%), Cajun ($87,157, a difference of 0.19%), Immigrants from Guatemala ($87,191, a difference of 0.23%), Yaqui ($87,289, a difference of 0.34%), and Fijian ($87,387, a difference of 0.46%).
DemographicsRating | RankMedian Family Income
Immigrants | Cabo Verde
0.1
/100
|
#291
Tragic
$87,830
Africans
0.1
/100
|
#292
Tragic
$87,820
Ute
0.0
/100
|
#293
Tragic
$87,596
Fijians
0.0
/100
|
#294
Tragic
$87,387
Yaqui
0.0
/100
|
#295
Tragic
$87,289
Immigrants | Guatemala
0.0
/100
|
#296
Tragic
$87,191
Cajuns
0.0
/100
|
#297
Tragic
$87,157
Immigrants | Latin America
0.0
/100
|
#298
Tragic
$86,989
Chippewa
0.0
/100
|
#299
Tragic
$86,852
Ottawa
0.0
/100
|
#300
Tragic
$86,380
Colville
0.0
/100
|
#301
Tragic
$85,792
Spanish American Indians
0.0
/100
|
#302
Tragic
$85,728
Hispanics or Latinos
0.0
/100
|
#303
Tragic
$85,647
Mexicans
0.0
/100
|
#304
Tragic
$85,618
Paiute
0.0
/100
|
#305
Tragic
$85,414