Cheyenne vs Immigrants from Latvia Median Male Earnings
COMPARE
Cheyenne
Immigrants from Latvia
Median Male Earnings
Median Male Earnings Comparison
Cheyenne
Immigrants from Latvia
$46,062
MEDIAN MALE EARNINGS
0.0/ 100
METRIC RATING
318th/ 347
METRIC RANK
$61,422
MEDIAN MALE EARNINGS
99.9/ 100
METRIC RATING
54th/ 347
METRIC RANK
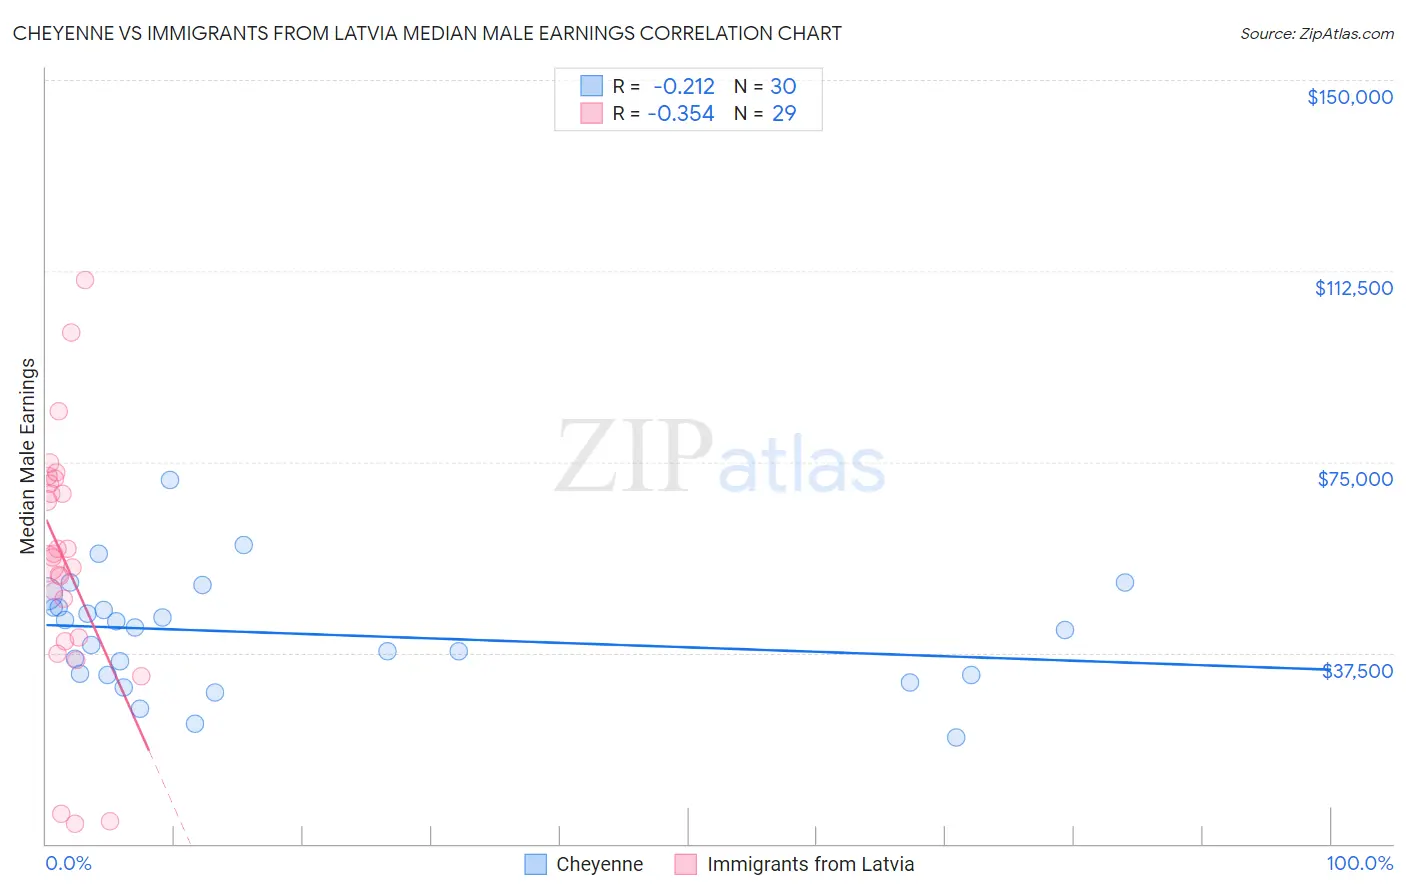
Cheyenne vs Immigrants from Latvia Median Male Earnings Correlation Chart
The statistical analysis conducted on geographies consisting of 80,706,071 people shows a weak negative correlation between the proportion of Cheyenne and median male earnings in the United States with a correlation coefficient (R) of -0.212 and weighted average of $46,062. Similarly, the statistical analysis conducted on geographies consisting of 113,724,849 people shows a mild negative correlation between the proportion of Immigrants from Latvia and median male earnings in the United States with a correlation coefficient (R) of -0.354 and weighted average of $61,422, a difference of 33.4%.
Median Male Earnings Correlation Summary
| Measurement | Cheyenne | Immigrants from Latvia |
| Minimum | $20,903 | $3,900 |
| Maximum | $71,550 | $110,833 |
| Range | $50,647 | $106,933 |
| Mean | $41,316 | $55,354 |
| Median | $42,260 | $56,127 |
| Interquartile 25% (IQ1) | $33,100 | $40,143 |
| Interquartile 75% (IQ3) | $46,481 | $71,183 |
| Interquartile Range (IQR) | $13,381 | $31,039 |
| Standard Deviation (Sample) | $10,984 | $24,947 |
| Standard Deviation (Population) | $10,799 | $24,513 |
Similar Demographics by Median Male Earnings
Demographics Similar to Cheyenne by Median Male Earnings
In terms of median male earnings, the demographic groups most similar to Cheyenne are Mexican ($46,147, a difference of 0.18%), Immigrants from Caribbean ($46,193, a difference of 0.28%), Haitian ($45,903, a difference of 0.35%), Immigrants from Guatemala ($46,244, a difference of 0.39%), and Immigrants from Honduras ($45,787, a difference of 0.60%).
| Demographics | Rating | Rank | Median Male Earnings |
| Apache | 0.0 /100 | #311 | Tragic $46,429 |
| Hispanics or Latinos | 0.0 /100 | #312 | Tragic $46,419 |
| Hondurans | 0.0 /100 | #313 | Tragic $46,374 |
| Chippewa | 0.0 /100 | #314 | Tragic $46,368 |
| Immigrants | Guatemala | 0.0 /100 | #315 | Tragic $46,244 |
| Immigrants | Caribbean | 0.0 /100 | #316 | Tragic $46,193 |
| Mexicans | 0.0 /100 | #317 | Tragic $46,147 |
| Cheyenne | 0.0 /100 | #318 | Tragic $46,062 |
| Haitians | 0.0 /100 | #319 | Tragic $45,903 |
| Immigrants | Honduras | 0.0 /100 | #320 | Tragic $45,787 |
| Fijians | 0.0 /100 | #321 | Tragic $45,607 |
| Sioux | 0.0 /100 | #322 | Tragic $45,566 |
| Immigrants | Central America | 0.0 /100 | #323 | Tragic $45,538 |
| Blacks/African Americans | 0.0 /100 | #324 | Tragic $45,523 |
| Yuman | 0.0 /100 | #325 | Tragic $45,446 |
Demographics Similar to Immigrants from Latvia by Median Male Earnings
In terms of median male earnings, the demographic groups most similar to Immigrants from Latvia are South African ($61,460, a difference of 0.060%), Greek ($61,242, a difference of 0.29%), Lithuanian ($61,228, a difference of 0.32%), Immigrants from Scotland ($61,220, a difference of 0.33%), and Immigrants from Norway ($61,628, a difference of 0.34%).
| Demographics | Rating | Rank | Median Male Earnings |
| Immigrants | Austria | 99.9 /100 | #47 | Exceptional $62,164 |
| Immigrants | Malaysia | 99.9 /100 | #48 | Exceptional $62,121 |
| Immigrants | Europe | 99.9 /100 | #49 | Exceptional $62,057 |
| Bhutanese | 99.9 /100 | #50 | Exceptional $61,759 |
| Estonians | 99.9 /100 | #51 | Exceptional $61,710 |
| Immigrants | Norway | 99.9 /100 | #52 | Exceptional $61,628 |
| South Africans | 99.9 /100 | #53 | Exceptional $61,460 |
| Immigrants | Latvia | 99.9 /100 | #54 | Exceptional $61,422 |
| Greeks | 99.9 /100 | #55 | Exceptional $61,242 |
| Lithuanians | 99.9 /100 | #56 | Exceptional $61,228 |
| Immigrants | Scotland | 99.9 /100 | #57 | Exceptional $61,220 |
| New Zealanders | 99.9 /100 | #58 | Exceptional $61,199 |
| Immigrants | Netherlands | 99.8 /100 | #59 | Exceptional $61,096 |
| Egyptians | 99.8 /100 | #60 | Exceptional $61,095 |
| Bolivians | 99.8 /100 | #61 | Exceptional $61,066 |