Cheyenne vs Immigrants from Europe Householder Income Ages 25 - 44 years

COMPARE

Cheyenne
Race
Ancestry
AfghanAfricanAlaska NativeAlaskan AthabascanAlbanianAleutAlsatianAmericanApacheArabArapahoArgentineanArmenianAssyrian/Chaldean/SyriacAustralianAustrianBahamianBangladeshiBarbadianBasqueBelgianBelizeanBermudanBhutaneseBlackfeetBolivianBrazilianBritishBritish West IndianBulgarianBurmeseCajunCambodianCanadianCape VerdeanCarpatho RusynCelticCentral AmericanCentral American IndianCherokeeCheyenneChickasawChileanChineseChippewaChoctawColombianColvilleComancheCosta RicanCreeCreekCroatianCrowCubanCypriotCzechCzechoslovakianDanishDelawareDominicanDutchDutch West IndianEastern EuropeanEcuadorianEgyptianEnglishEstonianEthiopianEuropeanFijianFilipinoFinnishFrenchFrench American IndianFrench CanadianGermanGerman RussianGhanaianGreekGuamanian/ChamorroGuatemalanGuyaneseHaitianHmongHonduranHopiHoumaHungarianIcelanderIndian (Asian)IndonesianInupiatIranianIraqiIrishIroquoisIsraeliItalianJamaicanJapaneseJordanianKenyanKiowaKoreanLaotianLatvianLebaneseLiberianLithuanianLumbeeLuxembourgerMacedonianMalaysianMalteseMarshalleseMenomineeMexicanMexican American IndianMongolianMoroccanNative HawaiianNavajoNepaleseNew ZealanderNicaraguanNigerianNorthern EuropeanNorwegianOkinawanOsageOttawaPaiutePakistaniPalestinianPanamanianParaguayanPennsylvania GermanPeruvianPimaPolishPortuguesePotawatomiPuebloPuerto RicanPuget Sound SalishRomanianRussianSalvadoranSamoanScandinavianScotch-IrishScottishSeminoleSenegaleseSerbianShoshoneSierra LeoneanSiouxSlavicSlovakSloveneSomaliSouth AfricanSouth AmericanSouth American IndianSoviet UnionSpaniardSpanishSpanish AmericanSpanish American IndianSri LankanSubsaharan AfricanSudaneseSwedishSwissSyrianTaiwaneseThaiTlingit-HaidaTohono O'OdhamTonganTrinidadian and TobagonianTsimshianTurkishU.S. Virgin IslanderUgandanUkrainianUruguayanUteVenezuelanVietnameseWelshWest IndianYakamaYaquiYugoslavianYumanYup'ikZimbabwean
Immigration
NonimmigrantsImmigrantsAfghanistanAfricaAlbaniaArgentinaArmeniaAsiaAustraliaAustriaBahamasBangladeshBarbadosBelarusBelgiumBelizeBoliviaBosnia and HerzegovinaBrazilBulgariaBurma/MyanmarCabo VerdeCambodiaCameroonCanadaCaribbeanCentral AmericaChileChinaColombiaCongoCosta RicaCroatiaCubaCzechoslovakiaDenmarkDominicaDominican RepublicEastern AfricaEastern AsiaEastern EuropeEcuadorEgyptEl SalvadorEnglandEritreaEthiopiaFijiFranceGermanyGhanaGreeceGrenadaGuatemalaGuyanaHaitiHondurasHong KongHungaryIndiaIndonesiaIranIraqIrelandIsraelItalyJamaicaJapanJordanKazakhstanKenyaKoreaKuwaitLaosLatin AmericaLatviaLebanonLiberiaLithuaniaMalaysiaMexicoMicronesiaMiddle AfricaMoldovaMoroccoNepalNetherlandsNicaraguaNigeriaNorth AmericaNorth MacedoniaNorthern AfricaNorthern EuropeNorwayOceaniaPakistanPanamaPeruPhilippinesPolandPortugalRomaniaRussiaSaudi ArabiaScotlandSenegalSerbiaSierra LeoneSingaporeSomaliaSouth AfricaSouth AmericaSouth Central AsiaSouth Eastern AsiaSouthern EuropeSpainSri LankaSt. Vincent and the GrenadinesSudanSwedenSwitzerlandSyriaTaiwanThailandTrinidad and TobagoTurkeyUgandaUkraineUruguayUzbekistanVenezuelaVietnamWest IndiesWestern AfricaWestern AsiaWestern EuropeYemenZaireZimbabweAzores
Immigrants from Europe
Race
Ancestry
AfghanAfricanAlaska NativeAlaskan AthabascanAlbanianAleutAlsatianAmericanApacheArabArapahoArgentineanArmenianAssyrian/Chaldean/SyriacAustralianAustrianBahamianBangladeshiBarbadianBasqueBelgianBelizeanBermudanBhutaneseBlackfeetBolivianBrazilianBritishBritish West IndianBulgarianBurmeseCajunCambodianCanadianCape VerdeanCarpatho RusynCelticCentral AmericanCentral American IndianCherokeeChickasawChileanChineseChippewaChoctawColombianColvilleComancheCosta RicanCreeCreekCroatianCrowCubanCypriotCzechCzechoslovakianDanishDelawareDominicanDutchDutch West IndianEastern EuropeanEcuadorianEgyptianEnglishEstonianEthiopianEuropeanFijianFilipinoFinnishFrenchFrench American IndianFrench CanadianGermanGerman RussianGhanaianGreekGuamanian/ChamorroGuatemalanGuyaneseHaitianHmongHonduranHopiHoumaHungarianIcelanderIndian (Asian)IndonesianInupiatIranianIraqiIrishIroquoisIsraeliItalianJamaicanJapaneseJordanianKenyanKiowaKoreanLaotianLatvianLebaneseLiberianLithuanianLumbeeLuxembourgerMacedonianMalaysianMalteseMarshalleseMenomineeMexicanMexican American IndianMongolianMoroccanNative HawaiianNavajoNepaleseNew ZealanderNicaraguanNigerianNorthern EuropeanNorwegianOkinawanOsageOttawaPaiutePakistaniPalestinianPanamanianParaguayanPennsylvania GermanPeruvianPimaPolishPortuguesePotawatomiPuebloPuerto RicanPuget Sound SalishRomanianRussianSalvadoranSamoanScandinavianScotch-IrishScottishSeminoleSenegaleseSerbianShoshoneSierra LeoneanSiouxSlavicSlovakSloveneSomaliSouth AfricanSouth AmericanSouth American IndianSoviet UnionSpaniardSpanishSpanish AmericanSpanish American IndianSri LankanSubsaharan AfricanSudaneseSwedishSwissSyrianTaiwaneseThaiTlingit-HaidaTohono O'OdhamTonganTrinidadian and TobagonianTsimshianTurkishU.S. Virgin IslanderUgandanUkrainianUruguayanUteVenezuelanVietnameseWelshWest IndianYakamaYaquiYugoslavianYumanYup'ikZimbabwean
Immigration
NonimmigrantsImmigrantsAfghanistanAfricaAlbaniaArgentinaArmeniaAsiaAustraliaAustriaBahamasBangladeshBarbadosBelarusBelgiumBelizeBoliviaBosnia and HerzegovinaBrazilBulgariaBurma/MyanmarCabo VerdeCambodiaCameroonCanadaCaribbeanCentral AmericaChileChinaColombiaCongoCosta RicaCroatiaCubaCzechoslovakiaDenmarkDominicaDominican RepublicEastern AfricaEastern AsiaEastern EuropeEcuadorEgyptEl SalvadorEnglandEritreaEthiopiaEuropeFijiFranceGermanyGhanaGreeceGrenadaGuatemalaGuyanaHaitiHondurasHong KongHungaryIndiaIndonesiaIranIraqIrelandIsraelItalyJamaicaJapanJordanKazakhstanKenyaKoreaKuwaitLaosLatin AmericaLatviaLebanonLiberiaLithuaniaMalaysiaMexicoMicronesiaMiddle AfricaMoldovaMoroccoNepalNetherlandsNicaraguaNigeriaNorth AmericaNorth MacedoniaNorthern AfricaNorthern EuropeNorwayOceaniaPakistanPanamaPeruPhilippinesPolandPortugalRomaniaRussiaSaudi ArabiaScotlandSenegalSerbiaSierra LeoneSingaporeSomaliaSouth AfricaSouth AmericaSouth Central AsiaSouth Eastern AsiaSouthern EuropeSpainSri LankaSt. Vincent and the GrenadinesSudanSwedenSwitzerlandSyriaTaiwanThailandTrinidad and TobagoTurkeyUgandaUkraineUruguayUzbekistanVenezuelaVietnamWest IndiesWestern AfricaWestern AsiaWestern EuropeYemenZaireZimbabweAzores
Householder Income Ages 25 - 44 years
Income
Poverty
Unemployment
Labor Participation
Family Structure
Vehicle Availability
Education Level
Disability

Householder Income Ages 25 - 44 years Comparison

Cheyenne

Immigrants from Europe

Tragic
Exceptional
$79,152
HOUSEHOLDER INCOME AGES 25 - 44 YEARS
0.0/ 100
METRIC RATING
314th/ 347
METRIC RANK
$106,817
HOUSEHOLDER INCOME AGES 25 - 44 YEARS
99.9/ 100
METRIC RATING
52nd/ 347
METRIC RANK

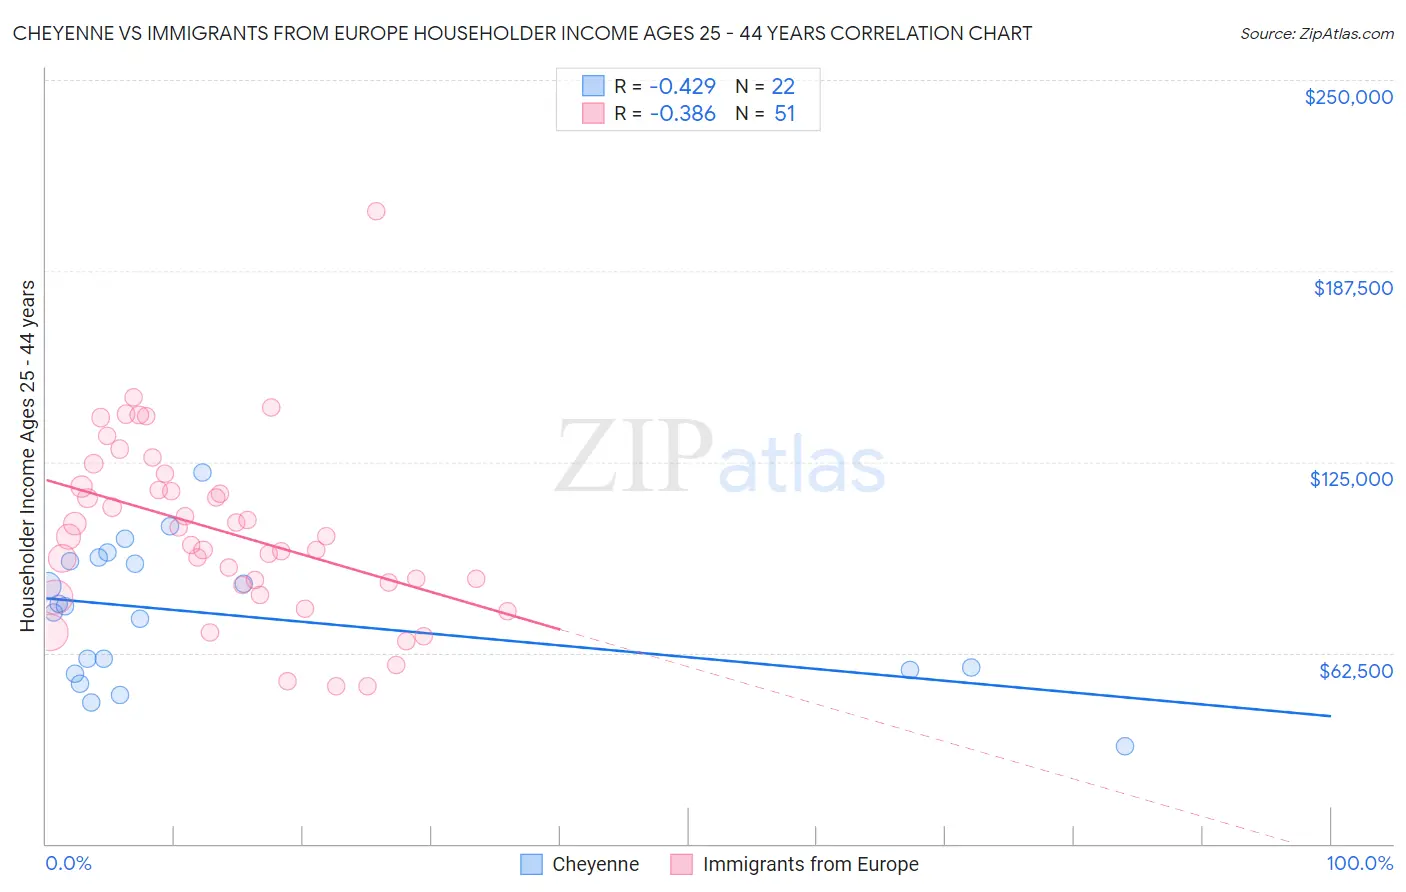
Cheyenne vs Immigrants from Europe Householder Income Ages 25 - 44 years Correlation Chart

The statistical analysis conducted on geographies consisting of 80,627,434 people shows a moderate negative correlation between the proportion of Cheyenne and household income with householder between the ages 25 and 44 in the United States with a correlation coefficient (R) of -0.429 and weighted average of $79,152. Similarly, the statistical analysis conducted on geographies consisting of 543,679,862 people shows a mild negative correlation between the proportion of Immigrants from Europe and household income with householder between the ages 25 and 44 in the United States with a correlation coefficient (R) of -0.386 and weighted average of $106,817, a difference of 34.9%.
Cheyenne vs Immigrants from Europe Householder Income Ages 25 - 44 years

Householder Income Ages 25 - 44 years Correlation Summary

MeasurementCheyenneImmigrants from Europe
Minimum$32,083$51,500
Maximum$121,699$206,875
Range$89,616$155,375
Mean$74,807$102,137
Median$76,769$100,565
Interquartile 25% (IQ1)$56,719$84,881
Interquartile 75% (IQ3)$92,585$116,874
Interquartile Range (IQR)$35,866$31,993
Standard Deviation (Sample)$22,346$29,199
Standard Deviation (Population)$21,832$28,912

Similar Demographics by Householder Income Ages 25 - 44 years

Demographics Similar to Cheyenne by Householder Income Ages 25 - 44 years

In terms of householder income ages 25 - 44 years, the demographic groups most similar to Cheyenne are Ottawa ($79,012, a difference of 0.18%), African ($78,986, a difference of 0.21%), Menominee ($79,358, a difference of 0.26%), Immigrants from Haiti ($79,391, a difference of 0.30%), and U.S. Virgin Islander ($78,911, a difference of 0.30%).
DemographicsRating | RankHouseholder Income Ages 25 - 44 years
Haitians
0.0
/100
|
#307
Tragic
$80,055
Immigrants | Central America
0.0
/100
|
#308
Tragic
$80,012
Chippewa
0.0
/100
|
#309
Tragic
$80,005
Fijians
0.0
/100
|
#310
Tragic
$79,956
Indonesians
0.0
/100
|
#311
Tragic
$79,543
Immigrants | Haiti
0.0
/100
|
#312
Tragic
$79,391
Menominee
0.0
/100
|
#313
Tragic
$79,358
Cheyenne
0.0
/100
|
#314
Tragic
$79,152
Ottawa
0.0
/100
|
#315
Tragic
$79,012
Africans
0.0
/100
|
#316
Tragic
$78,986
U.S. Virgin Islanders
0.0
/100
|
#317
Tragic
$78,911
Immigrants | Mexico
0.0
/100
|
#318
Tragic
$78,809
Hondurans
0.0
/100
|
#319
Tragic
$78,540
Choctaw
0.0
/100
|
#320
Tragic
$78,168
Immigrants | Zaire
0.0
/100
|
#321
Tragic
$78,045

Demographics Similar to Immigrants from Europe by Householder Income Ages 25 - 44 years

In terms of householder income ages 25 - 44 years, the demographic groups most similar to Immigrants from Europe are Immigrants from Czechoslovakia ($106,888, a difference of 0.070%), Immigrants from Norway ($106,629, a difference of 0.18%), Paraguayan ($106,615, a difference of 0.19%), Cambodian ($107,148, a difference of 0.31%), and Greek ($106,457, a difference of 0.34%).
DemographicsRating | RankHouseholder Income Ages 25 - 44 years
Israelis
99.9
/100
|
#45
Exceptional
$107,579
Immigrants | Belarus
99.9
/100
|
#46
Exceptional
$107,393
Estonians
99.9
/100
|
#47
Exceptional
$107,269
Bulgarians
99.9
/100
|
#48
Exceptional
$107,264
Immigrants | Turkey
99.9
/100
|
#49
Exceptional
$107,258
Cambodians
99.9
/100
|
#50
Exceptional
$107,148
Immigrants | Czechoslovakia
99.9
/100
|
#51
Exceptional
$106,888
Immigrants | Europe
99.9
/100
|
#52
Exceptional
$106,817
Immigrants | Norway
99.9
/100
|
#53
Exceptional
$106,629
Paraguayans
99.9
/100
|
#54
Exceptional
$106,615
Greeks
99.9
/100
|
#55
Exceptional
$106,457
Immigrants | Pakistan
99.8
/100
|
#56
Exceptional
$106,129
Immigrants | Austria
99.8
/100
|
#57
Exceptional
$106,103
Immigrants | South Africa
99.8
/100
|
#58
Exceptional
$105,748
Immigrants | Latvia
99.8
/100
|
#59
Exceptional
$105,522