Central American vs Navajo Median Family Income
COMPARE
Central American
Navajo
Median Family Income
Median Family Income Comparison
Central Americans
Navajo
$91,087
MEDIAN FAMILY INCOME
0.3/ 100
METRIC RATING
266th/ 347
METRIC RANK
$70,989
MEDIAN FAMILY INCOME
0.0/ 100
METRIC RATING
345th/ 347
METRIC RANK
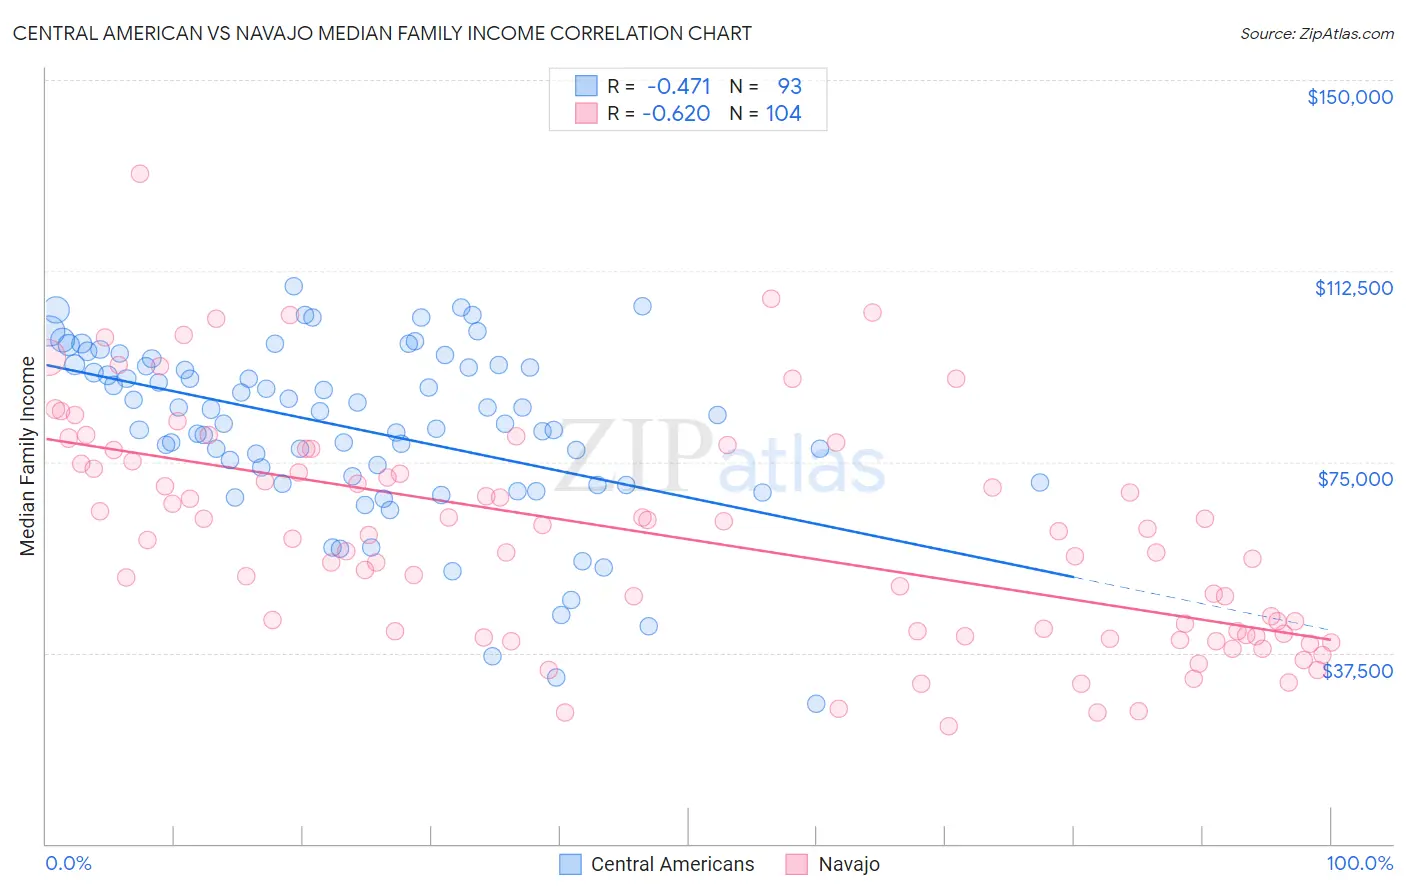
Central American vs Navajo Median Family Income Correlation Chart
The statistical analysis conducted on geographies consisting of 503,776,524 people shows a moderate negative correlation between the proportion of Central Americans and median family income in the United States with a correlation coefficient (R) of -0.471 and weighted average of $91,087. Similarly, the statistical analysis conducted on geographies consisting of 224,690,436 people shows a significant negative correlation between the proportion of Navajo and median family income in the United States with a correlation coefficient (R) of -0.620 and weighted average of $70,989, a difference of 28.3%.
Median Family Income Correlation Summary
| Measurement | Central American | Navajo |
| Minimum | $27,406 | $22,955 |
| Maximum | $109,579 | $131,574 |
| Range | $82,173 | $108,619 |
| Mean | $81,381 | $60,376 |
| Median | $84,167 | $59,766 |
| Interquartile 25% (IQ1) | $70,836 | $41,038 |
| Interquartile 75% (IQ3) | $93,875 | $74,887 |
| Interquartile Range (IQR) | $23,039 | $33,849 |
| Standard Deviation (Sample) | $17,262 | $22,079 |
| Standard Deviation (Population) | $17,169 | $21,972 |
Similar Demographics by Median Family Income
Demographics Similar to Central Americans by Median Family Income
In terms of median family income, the demographic groups most similar to Central Americans are Mexican American Indian ($90,918, a difference of 0.19%), Hmong ($91,296, a difference of 0.23%), Cree ($90,882, a difference of 0.23%), Belizean ($90,880, a difference of 0.23%), and Senegalese ($91,475, a difference of 0.43%).
| Demographics | Rating | Rank | Median Family Income |
| Cape Verdeans | 0.4 /100 | #259 | Tragic $91,848 |
| Pennsylvania Germans | 0.4 /100 | #260 | Tragic $91,763 |
| Inupiat | 0.4 /100 | #261 | Tragic $91,730 |
| Liberians | 0.4 /100 | #262 | Tragic $91,722 |
| Immigrants | West Indies | 0.3 /100 | #263 | Tragic $91,588 |
| Senegalese | 0.3 /100 | #264 | Tragic $91,475 |
| Hmong | 0.3 /100 | #265 | Tragic $91,296 |
| Central Americans | 0.3 /100 | #266 | Tragic $91,087 |
| Mexican American Indians | 0.2 /100 | #267 | Tragic $90,918 |
| Cree | 0.2 /100 | #268 | Tragic $90,882 |
| Belizeans | 0.2 /100 | #269 | Tragic $90,880 |
| Jamaicans | 0.2 /100 | #270 | Tragic $90,581 |
| Iroquois | 0.2 /100 | #271 | Tragic $90,543 |
| Immigrants | Liberia | 0.2 /100 | #272 | Tragic $90,450 |
| Immigrants | Micronesia | 0.2 /100 | #273 | Tragic $90,345 |
Demographics Similar to Navajo by Median Family Income
In terms of median family income, the demographic groups most similar to Navajo are Puerto Rican ($70,423, a difference of 0.80%), Tohono O'odham ($72,193, a difference of 1.7%), Lumbee ($68,679, a difference of 3.4%), Houma ($76,188, a difference of 7.3%), and Crow ($76,605, a difference of 7.9%).
| Demographics | Rating | Rank | Median Family Income |
| Kiowa | 0.0 /100 | #333 | Tragic $80,885 |
| Menominee | 0.0 /100 | #334 | Tragic $79,563 |
| Yup'ik | 0.0 /100 | #335 | Tragic $79,290 |
| Immigrants | Cuba | 0.0 /100 | #336 | Tragic $78,249 |
| Yuman | 0.0 /100 | #337 | Tragic $78,055 |
| Immigrants | Yemen | 0.0 /100 | #338 | Tragic $77,457 |
| Pima | 0.0 /100 | #339 | Tragic $77,431 |
| Hopi | 0.0 /100 | #340 | Tragic $77,188 |
| Pueblo | 0.0 /100 | #341 | Tragic $76,880 |
| Crow | 0.0 /100 | #342 | Tragic $76,605 |
| Houma | 0.0 /100 | #343 | Tragic $76,188 |
| Tohono O'odham | 0.0 /100 | #344 | Tragic $72,193 |
| Navajo | 0.0 /100 | #345 | Tragic $70,989 |
| Puerto Ricans | 0.0 /100 | #346 | Tragic $70,423 |
| Lumbee | 0.0 /100 | #347 | Tragic $68,679 |