Central American vs Immigrants from Belarus Householder Income Ages 45 - 64 years
COMPARE
Central American
Immigrants from Belarus
Householder Income Ages 45 - 64 years
Householder Income Ages 45 - 64 years Comparison
Central Americans
Immigrants from Belarus
$90,951
HOUSEHOLDER INCOME AGES 45 - 64 YEARS
0.9/ 100
METRIC RATING
246th/ 347
METRIC RANK
$111,430
HOUSEHOLDER INCOME AGES 45 - 64 YEARS
99.6/ 100
METRIC RATING
65th/ 347
METRIC RANK
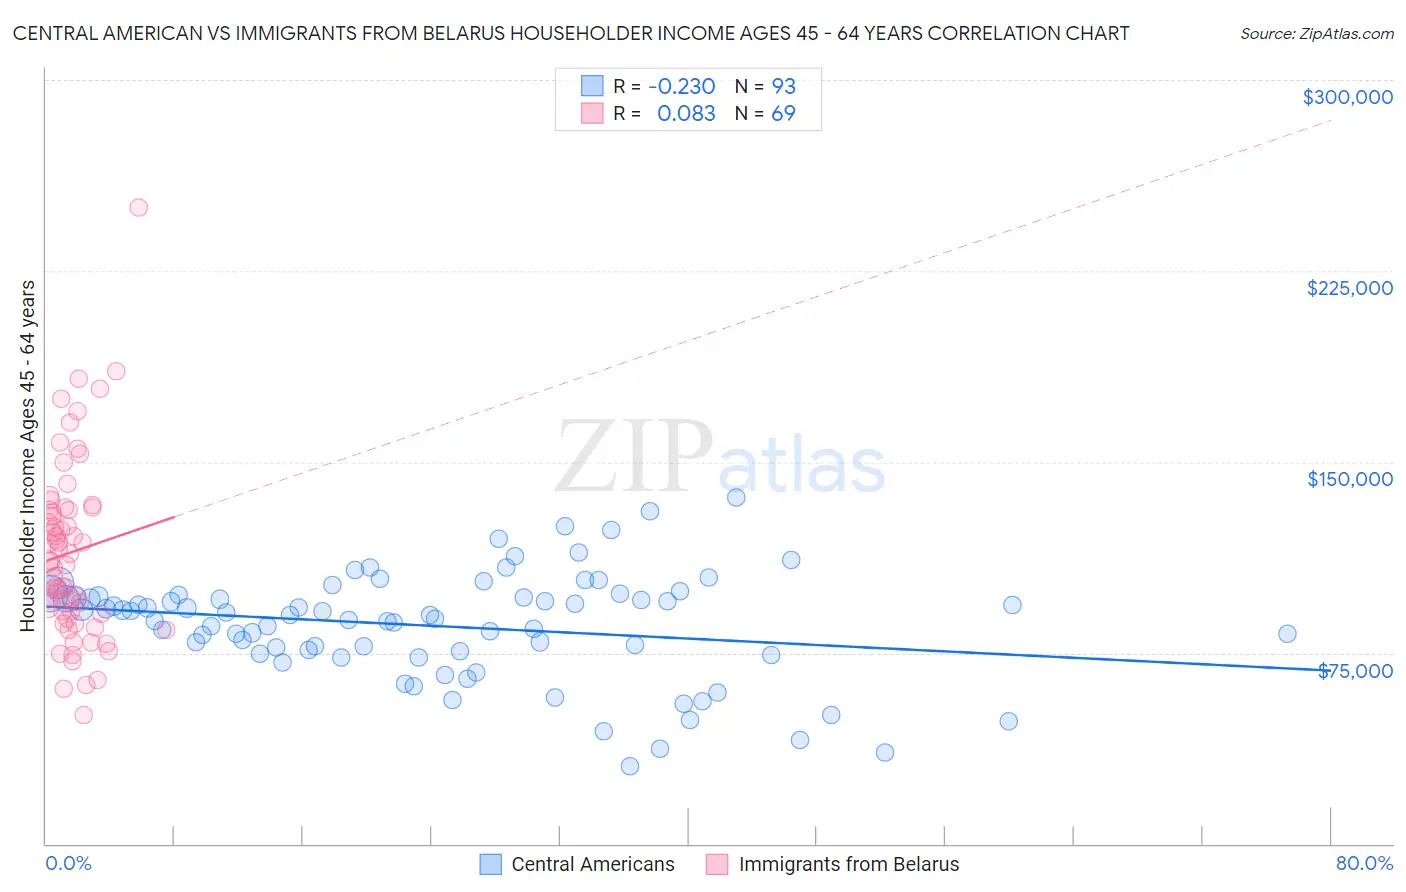
Central American vs Immigrants from Belarus Householder Income Ages 45 - 64 years Correlation Chart
The statistical analysis conducted on geographies consisting of 502,874,075 people shows a weak negative correlation between the proportion of Central Americans and household income with householder between the ages 45 and 64 in the United States with a correlation coefficient (R) of -0.230 and weighted average of $90,951. Similarly, the statistical analysis conducted on geographies consisting of 150,153,617 people shows a slight positive correlation between the proportion of Immigrants from Belarus and household income with householder between the ages 45 and 64 in the United States with a correlation coefficient (R) of 0.083 and weighted average of $111,430, a difference of 22.5%.
Householder Income Ages 45 - 64 years Correlation Summary
| Measurement | Central American | Immigrants from Belarus |
| Minimum | $30,221 | $50,645 |
| Maximum | $135,944 | $250,001 |
| Range | $105,723 | $199,356 |
| Mean | $85,574 | $114,531 |
| Median | $89,913 | $110,936 |
| Interquartile 25% (IQ1) | $75,128 | $89,337 |
| Interquartile 75% (IQ3) | $96,782 | $131,465 |
| Interquartile Range (IQR) | $21,654 | $42,127 |
| Standard Deviation (Sample) | $20,953 | $35,174 |
| Standard Deviation (Population) | $20,840 | $34,918 |
Similar Demographics by Householder Income Ages 45 - 64 years
Demographics Similar to Central Americans by Householder Income Ages 45 - 64 years
In terms of householder income ages 45 - 64 years, the demographic groups most similar to Central Americans are Alaskan Athabascan ($90,951, a difference of 0.0%), Guyanese ($90,966, a difference of 0.020%), Immigrants from Laos ($90,909, a difference of 0.050%), Mexican American Indian ($90,811, a difference of 0.15%), and Subsaharan African ($90,691, a difference of 0.29%).
| Demographics | Rating | Rank | Householder Income Ages 45 - 64 years |
| Immigrants | Ecuador | 1.2 /100 | #239 | Tragic $91,462 |
| Immigrants | Burma/Myanmar | 1.1 /100 | #240 | Tragic $91,385 |
| Trinidadians and Tobagonians | 1.1 /100 | #241 | Tragic $91,357 |
| Inupiat | 1.1 /100 | #242 | Tragic $91,355 |
| Immigrants | Trinidad and Tobago | 1.1 /100 | #243 | Tragic $91,347 |
| Immigrants | Middle Africa | 1.1 /100 | #244 | Tragic $91,293 |
| Guyanese | 0.9 /100 | #245 | Tragic $90,966 |
| Central Americans | 0.9 /100 | #246 | Tragic $90,951 |
| Alaskan Athabascans | 0.9 /100 | #247 | Tragic $90,951 |
| Immigrants | Laos | 0.9 /100 | #248 | Tragic $90,909 |
| Mexican American Indians | 0.8 /100 | #249 | Tragic $90,811 |
| Sub-Saharan Africans | 0.8 /100 | #250 | Tragic $90,691 |
| Americans | 0.7 /100 | #251 | Tragic $90,536 |
| Marshallese | 0.7 /100 | #252 | Tragic $90,455 |
| Barbadians | 0.6 /100 | #253 | Tragic $90,266 |
Demographics Similar to Immigrants from Belarus by Householder Income Ages 45 - 64 years
In terms of householder income ages 45 - 64 years, the demographic groups most similar to Immigrants from Belarus are Immigrants from Latvia ($111,454, a difference of 0.020%), New Zealander ($111,286, a difference of 0.13%), Mongolian ($111,602, a difference of 0.15%), Immigrants from Norway ($111,669, a difference of 0.21%), and Laotian ($111,051, a difference of 0.34%).
| Demographics | Rating | Rank | Householder Income Ages 45 - 64 years |
| Soviet Union | 99.7 /100 | #58 | Exceptional $112,008 |
| Immigrants | Europe | 99.7 /100 | #59 | Exceptional $111,984 |
| Immigrants | Netherlands | 99.7 /100 | #60 | Exceptional $111,982 |
| Immigrants | Czechoslovakia | 99.7 /100 | #61 | Exceptional $111,914 |
| Immigrants | Norway | 99.7 /100 | #62 | Exceptional $111,669 |
| Mongolians | 99.6 /100 | #63 | Exceptional $111,602 |
| Immigrants | Latvia | 99.6 /100 | #64 | Exceptional $111,454 |
| Immigrants | Belarus | 99.6 /100 | #65 | Exceptional $111,430 |
| New Zealanders | 99.6 /100 | #66 | Exceptional $111,286 |
| Laotians | 99.5 /100 | #67 | Exceptional $111,051 |
| Immigrants | Romania | 99.4 /100 | #68 | Exceptional $110,633 |
| Immigrants | Italy | 99.4 /100 | #69 | Exceptional $110,434 |
| Koreans | 99.3 /100 | #70 | Exceptional $110,334 |
| Italians | 99.3 /100 | #71 | Exceptional $110,224 |
| Assyrians/Chaldeans/Syriacs | 99.3 /100 | #72 | Exceptional $110,201 |