Central American Indian vs Immigrants from Korea Median Earnings
COMPARE
Central American Indian
Immigrants from Korea
Median Earnings
Median Earnings Comparison
Central American Indians
Immigrants from Korea
$41,474
MEDIAN EARNINGS
0.1/ 100
METRIC RATING
291st/ 347
METRIC RANK
$54,530
MEDIAN EARNINGS
100.0/ 100
METRIC RATING
22nd/ 347
METRIC RANK
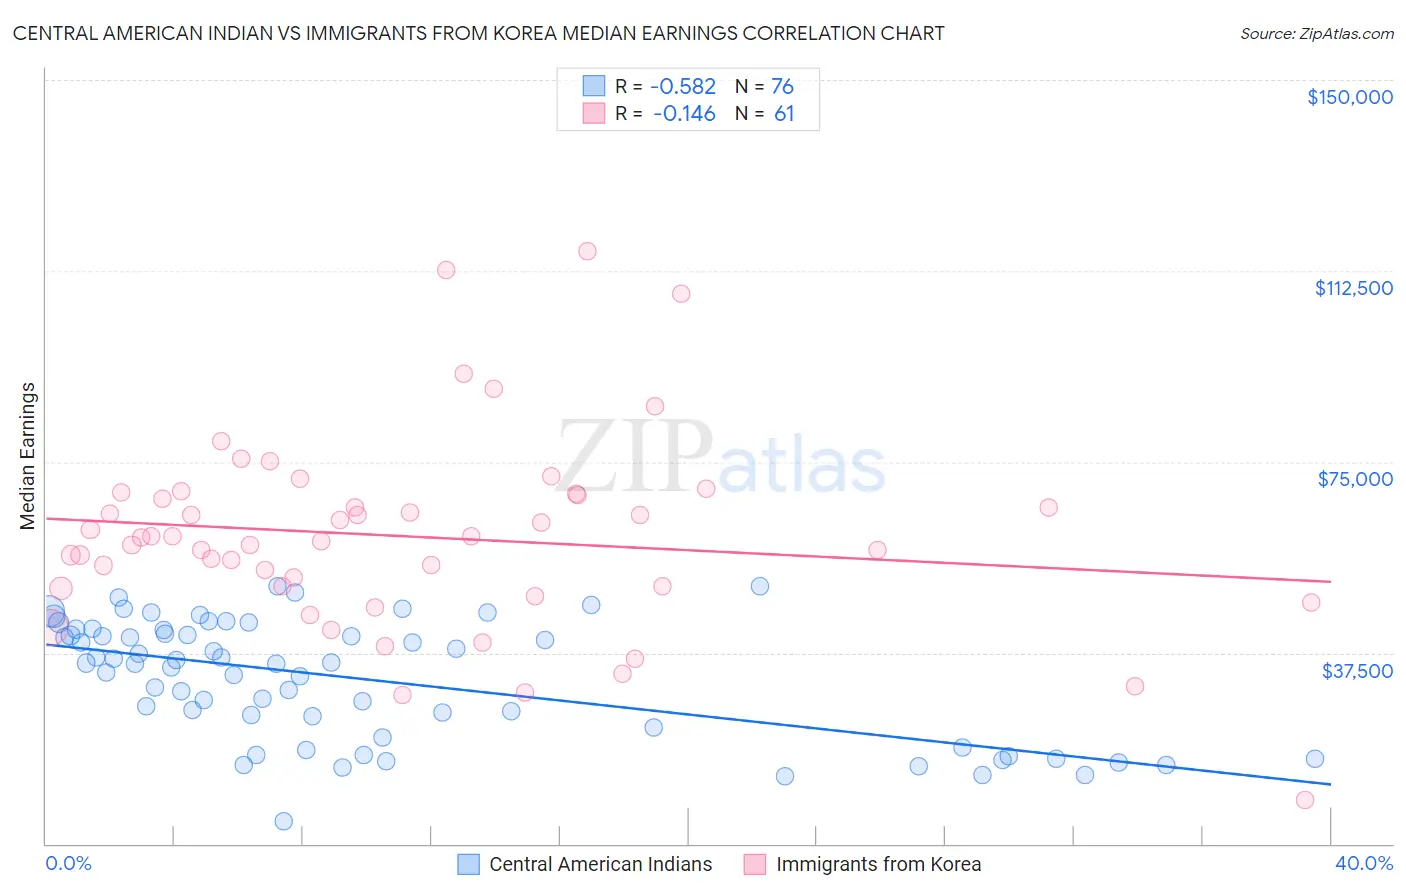
Central American Indian vs Immigrants from Korea Median Earnings Correlation Chart
The statistical analysis conducted on geographies consisting of 326,124,728 people shows a substantial negative correlation between the proportion of Central American Indians and median earnings in the United States with a correlation coefficient (R) of -0.582 and weighted average of $41,474. Similarly, the statistical analysis conducted on geographies consisting of 416,330,492 people shows a poor negative correlation between the proportion of Immigrants from Korea and median earnings in the United States with a correlation coefficient (R) of -0.146 and weighted average of $54,530, a difference of 31.5%.
Median Earnings Correlation Summary
| Measurement | Central American Indian | Immigrants from Korea |
| Minimum | $4,300 | $8,707 |
| Maximum | $50,550 | $116,380 |
| Range | $46,250 | $107,673 |
| Mean | $32,321 | $60,321 |
| Median | $35,426 | $60,242 |
| Interquartile 25% (IQ1) | $21,944 | $50,376 |
| Interquartile 75% (IQ3) | $41,662 | $68,586 |
| Interquartile Range (IQR) | $19,717 | $18,211 |
| Standard Deviation (Sample) | $11,652 | $19,123 |
| Standard Deviation (Population) | $11,575 | $18,966 |
Similar Demographics by Median Earnings
Demographics Similar to Central American Indians by Median Earnings
In terms of median earnings, the demographic groups most similar to Central American Indians are U.S. Virgin Islander ($41,448, a difference of 0.060%), Paiute ($41,508, a difference of 0.080%), Comanche ($41,519, a difference of 0.11%), Immigrants from Dominican Republic ($41,554, a difference of 0.19%), and Immigrants from Zaire ($41,325, a difference of 0.36%).
| Demographics | Rating | Rank | Median Earnings |
| Blackfeet | 0.2 /100 | #284 | Tragic $41,822 |
| Immigrants | Nicaragua | 0.1 /100 | #285 | Tragic $41,737 |
| Mexican American Indians | 0.1 /100 | #286 | Tragic $41,719 |
| Indonesians | 0.1 /100 | #287 | Tragic $41,701 |
| Immigrants | Dominican Republic | 0.1 /100 | #288 | Tragic $41,554 |
| Comanche | 0.1 /100 | #289 | Tragic $41,519 |
| Paiute | 0.1 /100 | #290 | Tragic $41,508 |
| Central American Indians | 0.1 /100 | #291 | Tragic $41,474 |
| U.S. Virgin Islanders | 0.1 /100 | #292 | Tragic $41,448 |
| Immigrants | Zaire | 0.1 /100 | #293 | Tragic $41,325 |
| Potawatomi | 0.1 /100 | #294 | Tragic $41,288 |
| Bangladeshis | 0.1 /100 | #295 | Tragic $41,263 |
| Cherokee | 0.1 /100 | #296 | Tragic $41,252 |
| Guatemalans | 0.1 /100 | #297 | Tragic $41,205 |
| Immigrants | Micronesia | 0.1 /100 | #298 | Tragic $41,133 |
Demographics Similar to Immigrants from Korea by Median Earnings
In terms of median earnings, the demographic groups most similar to Immigrants from Korea are Burmese ($54,559, a difference of 0.050%), Immigrants from Sweden ($54,478, a difference of 0.10%), Cypriot ($54,589, a difference of 0.11%), Immigrants from Belgium ($54,679, a difference of 0.27%), and Soviet Union ($54,290, a difference of 0.44%).
| Demographics | Rating | Rank | Median Earnings |
| Indians (Asian) | 100.0 /100 | #15 | Exceptional $56,253 |
| Immigrants | Eastern Asia | 100.0 /100 | #16 | Exceptional $56,183 |
| Eastern Europeans | 100.0 /100 | #17 | Exceptional $55,084 |
| Immigrants | Japan | 100.0 /100 | #18 | Exceptional $54,938 |
| Immigrants | Belgium | 100.0 /100 | #19 | Exceptional $54,679 |
| Cypriots | 100.0 /100 | #20 | Exceptional $54,589 |
| Burmese | 100.0 /100 | #21 | Exceptional $54,559 |
| Immigrants | Korea | 100.0 /100 | #22 | Exceptional $54,530 |
| Immigrants | Sweden | 100.0 /100 | #23 | Exceptional $54,478 |
| Soviet Union | 100.0 /100 | #24 | Exceptional $54,290 |
| Turks | 100.0 /100 | #25 | Exceptional $53,919 |
| Immigrants | Northern Europe | 100.0 /100 | #26 | Exceptional $53,872 |
| Asians | 100.0 /100 | #27 | Exceptional $53,690 |
| Immigrants | France | 100.0 /100 | #28 | Exceptional $53,490 |
| Immigrants | Russia | 100.0 /100 | #29 | Exceptional $53,457 |