Canadian vs French Median Earnings
COMPARE
Canadian
French
Median Earnings
Median Earnings Comparison
Canadians
French
$47,911
MEDIAN EARNINGS
88.8/ 100
METRIC RATING
139th/ 347
METRIC RANK
$46,296
MEDIAN EARNINGS
45.2/ 100
METRIC RATING
183rd/ 347
METRIC RANK
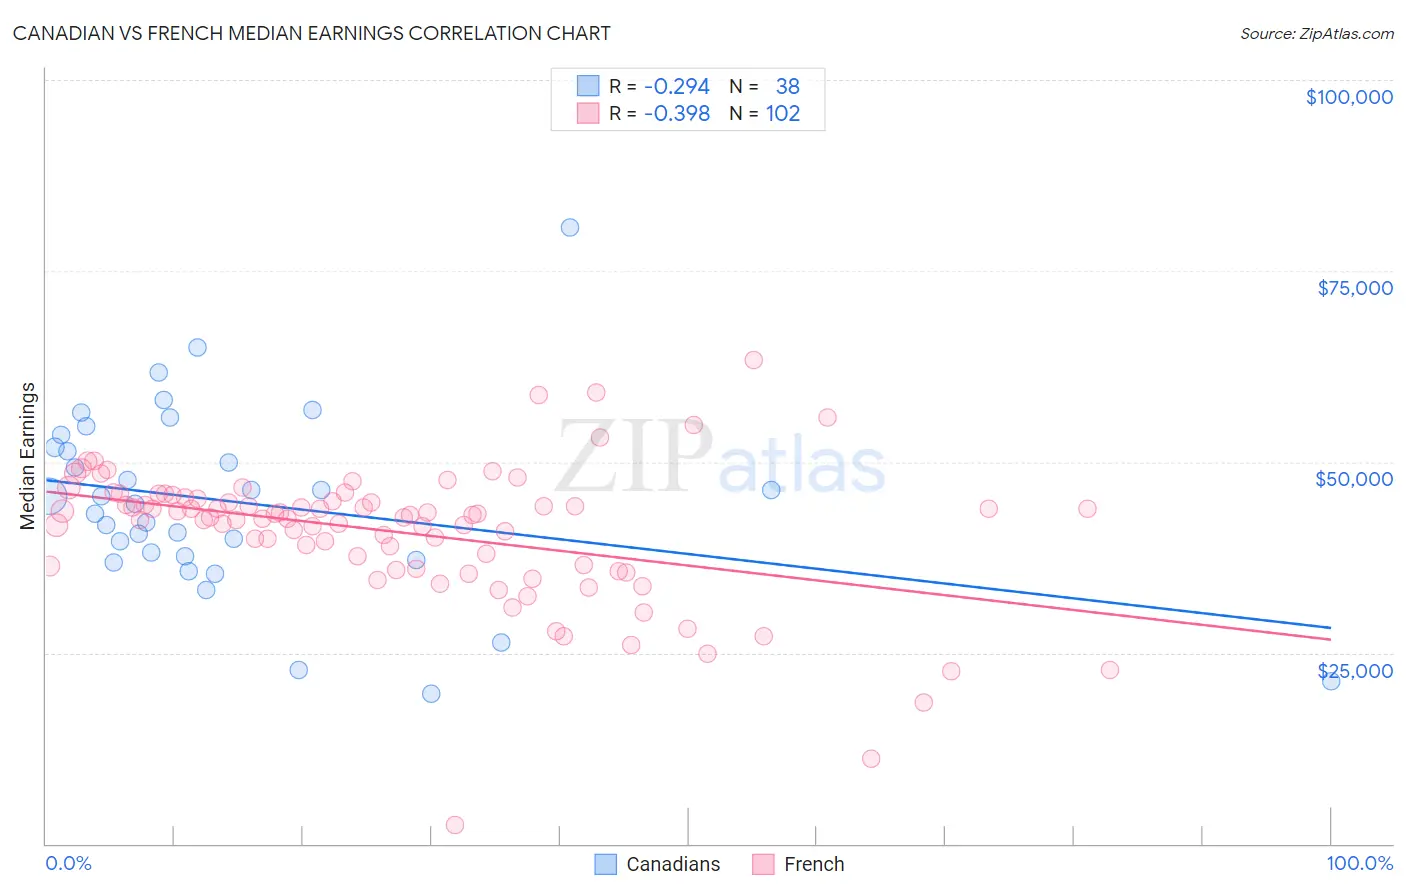
Canadian vs French Median Earnings Correlation Chart
The statistical analysis conducted on geographies consisting of 437,494,547 people shows a weak negative correlation between the proportion of Canadians and median earnings in the United States with a correlation coefficient (R) of -0.294 and weighted average of $47,911. Similarly, the statistical analysis conducted on geographies consisting of 572,035,046 people shows a mild negative correlation between the proportion of French and median earnings in the United States with a correlation coefficient (R) of -0.398 and weighted average of $46,296, a difference of 3.5%.
Median Earnings Correlation Summary
| Measurement | Canadian | French |
| Minimum | $19,688 | $2,499 |
| Maximum | $80,682 | $63,271 |
| Range | $60,994 | $60,772 |
| Mean | $44,712 | $40,779 |
| Median | $44,948 | $42,886 |
| Interquartile 25% (IQ1) | $37,642 | $36,330 |
| Interquartile 75% (IQ3) | $51,935 | $45,125 |
| Interquartile Range (IQR) | $14,293 | $8,794 |
| Standard Deviation (Sample) | $12,220 | $9,085 |
| Standard Deviation (Population) | $12,058 | $9,040 |
Similar Demographics by Median Earnings
Demographics Similar to Canadians by Median Earnings
In terms of median earnings, the demographic groups most similar to Canadians are European ($47,915, a difference of 0.010%), Taiwanese ($47,902, a difference of 0.020%), Immigrants from Nepal ($47,925, a difference of 0.030%), Immigrants from Sierra Leone ($47,875, a difference of 0.080%), and Ugandan ($47,854, a difference of 0.12%).
| Demographics | Rating | Rank | Median Earnings |
| British | 92.2 /100 | #132 | Exceptional $48,189 |
| Immigrants | Uganda | 90.5 /100 | #133 | Exceptional $48,041 |
| Sri Lankans | 90.5 /100 | #134 | Exceptional $48,040 |
| Portuguese | 90.4 /100 | #135 | Exceptional $48,032 |
| Slovenes | 90.0 /100 | #136 | Excellent $47,995 |
| Immigrants | Nepal | 89.0 /100 | #137 | Excellent $47,925 |
| Europeans | 88.9 /100 | #138 | Excellent $47,915 |
| Canadians | 88.8 /100 | #139 | Excellent $47,911 |
| Taiwanese | 88.7 /100 | #140 | Excellent $47,902 |
| Immigrants | Sierra Leone | 88.3 /100 | #141 | Excellent $47,875 |
| Ugandans | 88.0 /100 | #142 | Excellent $47,854 |
| Swedes | 88.0 /100 | #143 | Excellent $47,851 |
| Hungarians | 87.1 /100 | #144 | Excellent $47,795 |
| Immigrants | Saudi Arabia | 85.6 /100 | #145 | Excellent $47,704 |
| Immigrants | Chile | 85.5 /100 | #146 | Excellent $47,697 |
Demographics Similar to French by Median Earnings
In terms of median earnings, the demographic groups most similar to French are Swiss ($46,315, a difference of 0.040%), Immigrants from Cameroon ($46,329, a difference of 0.070%), English ($46,334, a difference of 0.080%), Puget Sound Salish ($46,333, a difference of 0.080%), and Colombian ($46,349, a difference of 0.12%).
| Demographics | Rating | Rank | Median Earnings |
| Danes | 48.6 /100 | #176 | Average $46,392 |
| Belgians | 48.0 /100 | #177 | Average $46,375 |
| Colombians | 47.1 /100 | #178 | Average $46,349 |
| English | 46.5 /100 | #179 | Average $46,334 |
| Puget Sound Salish | 46.5 /100 | #180 | Average $46,333 |
| Immigrants | Cameroon | 46.4 /100 | #181 | Average $46,329 |
| Swiss | 45.9 /100 | #182 | Average $46,315 |
| French | 45.2 /100 | #183 | Average $46,296 |
| Immigrants | Kenya | 42.4 /100 | #184 | Average $46,214 |
| Uruguayans | 41.6 /100 | #185 | Average $46,190 |
| Vietnamese | 40.9 /100 | #186 | Average $46,172 |
| Iraqis | 39.9 /100 | #187 | Fair $46,140 |
| Immigrants | Armenia | 38.3 /100 | #188 | Fair $46,094 |
| Spaniards | 37.2 /100 | #189 | Fair $46,059 |
| French Canadians | 36.1 /100 | #190 | Fair $46,026 |