Belizean vs Immigrants from Somalia Householder Income Ages 25 - 44 years
COMPARE
Belizean
Immigrants from Somalia
Householder Income Ages 25 - 44 years
Householder Income Ages 25 - 44 years Comparison
Belizeans
Immigrants from Somalia
$84,534
HOUSEHOLDER INCOME AGES 25 - 44 YEARS
0.4/ 100
METRIC RATING
263rd/ 347
METRIC RANK
$82,188
HOUSEHOLDER INCOME AGES 25 - 44 YEARS
0.1/ 100
METRIC RATING
285th/ 347
METRIC RANK
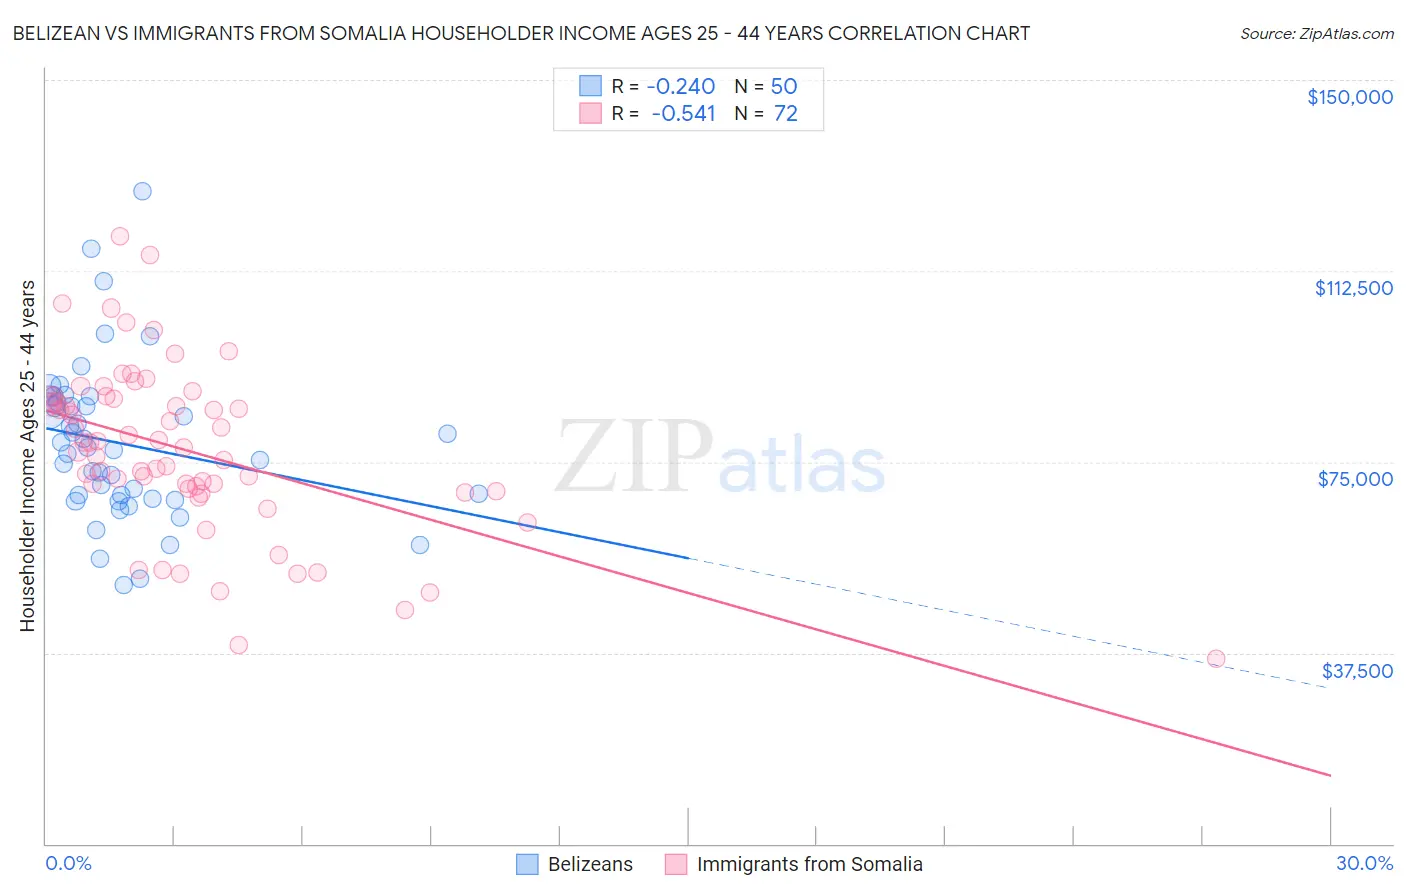
Belizean vs Immigrants from Somalia Householder Income Ages 25 - 44 years Correlation Chart
The statistical analysis conducted on geographies consisting of 144,109,917 people shows a weak negative correlation between the proportion of Belizeans and household income with householder between the ages 25 and 44 in the United States with a correlation coefficient (R) of -0.240 and weighted average of $84,534. Similarly, the statistical analysis conducted on geographies consisting of 92,085,049 people shows a substantial negative correlation between the proportion of Immigrants from Somalia and household income with householder between the ages 25 and 44 in the United States with a correlation coefficient (R) of -0.541 and weighted average of $82,188, a difference of 2.9%.
Householder Income Ages 25 - 44 years Correlation Summary
| Measurement | Belizean | Immigrants from Somalia |
| Minimum | $50,928 | $36,409 |
| Maximum | $128,125 | $119,233 |
| Range | $77,197 | $82,824 |
| Mean | $78,550 | $77,251 |
| Median | $77,650 | $78,315 |
| Interquartile 25% (IQ1) | $67,791 | $69,397 |
| Interquartile 75% (IQ3) | $86,760 | $87,226 |
| Interquartile Range (IQR) | $18,970 | $17,829 |
| Standard Deviation (Sample) | $15,455 | $16,543 |
| Standard Deviation (Population) | $15,299 | $16,428 |
Similar Demographics by Householder Income Ages 25 - 44 years
Demographics Similar to Belizeans by Householder Income Ages 25 - 44 years
In terms of householder income ages 25 - 44 years, the demographic groups most similar to Belizeans are Cree ($84,574, a difference of 0.050%), Osage ($84,461, a difference of 0.090%), Inupiat ($84,619, a difference of 0.10%), Sudanese ($84,401, a difference of 0.16%), and Immigrants from Cabo Verde ($84,304, a difference of 0.27%).
| Demographics | Rating | Rank | Householder Income Ages 25 - 44 years |
| Central Americans | 0.5 /100 | #256 | Tragic $85,144 |
| Mexican American Indians | 0.5 /100 | #257 | Tragic $85,066 |
| Immigrants | Nicaragua | 0.5 /100 | #258 | Tragic $84,914 |
| Immigrants | Senegal | 0.5 /100 | #259 | Tragic $84,848 |
| Americans | 0.4 /100 | #260 | Tragic $84,791 |
| Inupiat | 0.4 /100 | #261 | Tragic $84,619 |
| Cree | 0.4 /100 | #262 | Tragic $84,574 |
| Belizeans | 0.4 /100 | #263 | Tragic $84,534 |
| Osage | 0.4 /100 | #264 | Tragic $84,461 |
| Sudanese | 0.4 /100 | #265 | Tragic $84,401 |
| Immigrants | Cabo Verde | 0.3 /100 | #266 | Tragic $84,304 |
| Hmong | 0.3 /100 | #267 | Tragic $84,258 |
| Sub-Saharan Africans | 0.3 /100 | #268 | Tragic $84,235 |
| Spanish American Indians | 0.3 /100 | #269 | Tragic $84,085 |
| Jamaicans | 0.3 /100 | #270 | Tragic $83,933 |
Demographics Similar to Immigrants from Somalia by Householder Income Ages 25 - 44 years
In terms of householder income ages 25 - 44 years, the demographic groups most similar to Immigrants from Somalia are Ute ($82,166, a difference of 0.030%), Immigrants from Latin America ($82,166, a difference of 0.030%), Comanche ($82,152, a difference of 0.040%), Immigrants from Middle Africa ($82,254, a difference of 0.080%), and Shoshone ($82,062, a difference of 0.15%).
| Demographics | Rating | Rank | Householder Income Ages 25 - 44 years |
| Senegalese | 0.2 /100 | #278 | Tragic $82,852 |
| Pima | 0.1 /100 | #279 | Tragic $82,821 |
| Colville | 0.1 /100 | #280 | Tragic $82,604 |
| Cajuns | 0.1 /100 | #281 | Tragic $82,393 |
| Central American Indians | 0.1 /100 | #282 | Tragic $82,355 |
| Guatemalans | 0.1 /100 | #283 | Tragic $82,331 |
| Immigrants | Middle Africa | 0.1 /100 | #284 | Tragic $82,254 |
| Immigrants | Somalia | 0.1 /100 | #285 | Tragic $82,188 |
| Ute | 0.1 /100 | #286 | Tragic $82,166 |
| Immigrants | Latin America | 0.1 /100 | #287 | Tragic $82,166 |
| Comanche | 0.1 /100 | #288 | Tragic $82,152 |
| Shoshone | 0.1 /100 | #289 | Tragic $82,062 |
| Liberians | 0.1 /100 | #290 | Tragic $82,005 |
| Potawatomi | 0.1 /100 | #291 | Tragic $81,774 |
| Yaqui | 0.1 /100 | #292 | Tragic $81,656 |