Belizean vs Immigrants from Latin America Median Household Income
COMPARE
Belizean
Immigrants from Latin America
Median Household Income
Median Household Income Comparison
Belizeans
Immigrants from Latin America
$77,028
MEDIAN HOUSEHOLD INCOME
0.6/ 100
METRIC RATING
256th/ 347
METRIC RANK
$75,420
MEDIAN HOUSEHOLD INCOME
0.2/ 100
METRIC RATING
276th/ 347
METRIC RANK
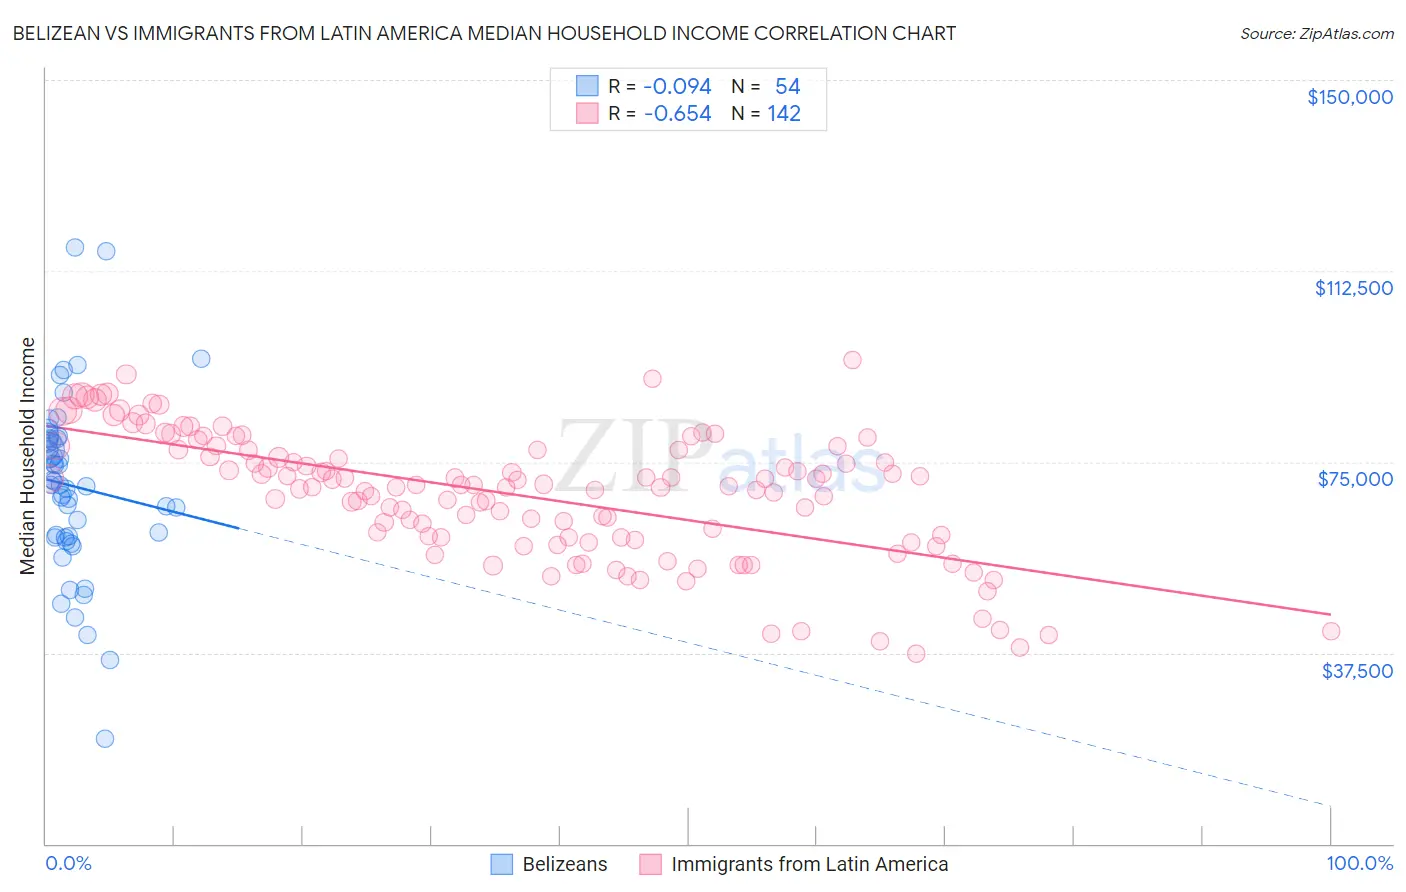
Belizean vs Immigrants from Latin America Median Household Income Correlation Chart
The statistical analysis conducted on geographies consisting of 144,146,880 people shows a slight negative correlation between the proportion of Belizeans and median household income in the United States with a correlation coefficient (R) of -0.094 and weighted average of $77,028. Similarly, the statistical analysis conducted on geographies consisting of 557,585,131 people shows a significant negative correlation between the proportion of Immigrants from Latin America and median household income in the United States with a correlation coefficient (R) of -0.654 and weighted average of $75,420, a difference of 2.1%.
Median Household Income Correlation Summary
| Measurement | Belizean | Immigrants from Latin America |
| Minimum | $20,723 | $37,370 |
| Maximum | $117,113 | $94,905 |
| Range | $96,390 | $57,535 |
| Mean | $70,224 | $68,616 |
| Median | $70,434 | $70,288 |
| Interquartile 25% (IQ1) | $60,138 | $60,228 |
| Interquartile 75% (IQ3) | $79,527 | $77,376 |
| Interquartile Range (IQR) | $19,389 | $17,148 |
| Standard Deviation (Sample) | $17,495 | $12,455 |
| Standard Deviation (Population) | $17,332 | $12,411 |
Demographics Similar to Belizeans and Immigrants from Latin America by Median Household Income
In terms of median household income, the demographic groups most similar to Belizeans are Immigrants from Senegal ($76,915, a difference of 0.15%), Immigrants from Nicaragua ($76,784, a difference of 0.32%), Spanish American Indian ($76,670, a difference of 0.47%), Jamaican ($76,583, a difference of 0.58%), and Immigrants from Grenada ($76,517, a difference of 0.67%). Similarly, the demographic groups most similar to Immigrants from Latin America are Immigrants from Micronesia ($75,574, a difference of 0.20%), British West Indian ($75,647, a difference of 0.30%), Liberian ($75,667, a difference of 0.33%), Somali ($75,782, a difference of 0.48%), and Pennsylvania German ($75,814, a difference of 0.52%).
| Demographics | Rating | Rank | Median Household Income |
| Belizeans | 0.6 /100 | #256 | Tragic $77,028 |
| Immigrants | Senegal | 0.5 /100 | #257 | Tragic $76,915 |
| Immigrants | Nicaragua | 0.5 /100 | #258 | Tragic $76,784 |
| Spanish American Indians | 0.4 /100 | #259 | Tragic $76,670 |
| Jamaicans | 0.4 /100 | #260 | Tragic $76,583 |
| Immigrants | Grenada | 0.4 /100 | #261 | Tragic $76,517 |
| French American Indians | 0.4 /100 | #262 | Tragic $76,387 |
| Alaskan Athabascans | 0.4 /100 | #263 | Tragic $76,383 |
| Guatemalans | 0.3 /100 | #264 | Tragic $75,961 |
| Immigrants | Belize | 0.3 /100 | #265 | Tragic $75,938 |
| Americans | 0.3 /100 | #266 | Tragic $75,932 |
| German Russians | 0.3 /100 | #267 | Tragic $75,856 |
| Immigrants | Jamaica | 0.3 /100 | #268 | Tragic $75,851 |
| Cape Verdeans | 0.3 /100 | #269 | Tragic $75,848 |
| Hmong | 0.3 /100 | #270 | Tragic $75,839 |
| Pennsylvania Germans | 0.3 /100 | #271 | Tragic $75,814 |
| Somalis | 0.3 /100 | #272 | Tragic $75,782 |
| Liberians | 0.2 /100 | #273 | Tragic $75,667 |
| British West Indians | 0.2 /100 | #274 | Tragic $75,647 |
| Immigrants | Micronesia | 0.2 /100 | #275 | Tragic $75,574 |
| Immigrants | Latin America | 0.2 /100 | #276 | Tragic $75,420 |