Belizean vs Immigrants from Europe Median Family Income
COMPARE
Belizean
Immigrants from Europe
Median Family Income
Median Family Income Comparison
Belizeans
Immigrants from Europe
$90,880
MEDIAN FAMILY INCOME
0.2/ 100
METRIC RATING
269th/ 347
METRIC RANK
$115,523
MEDIAN FAMILY INCOME
99.9/ 100
METRIC RATING
54th/ 347
METRIC RANK
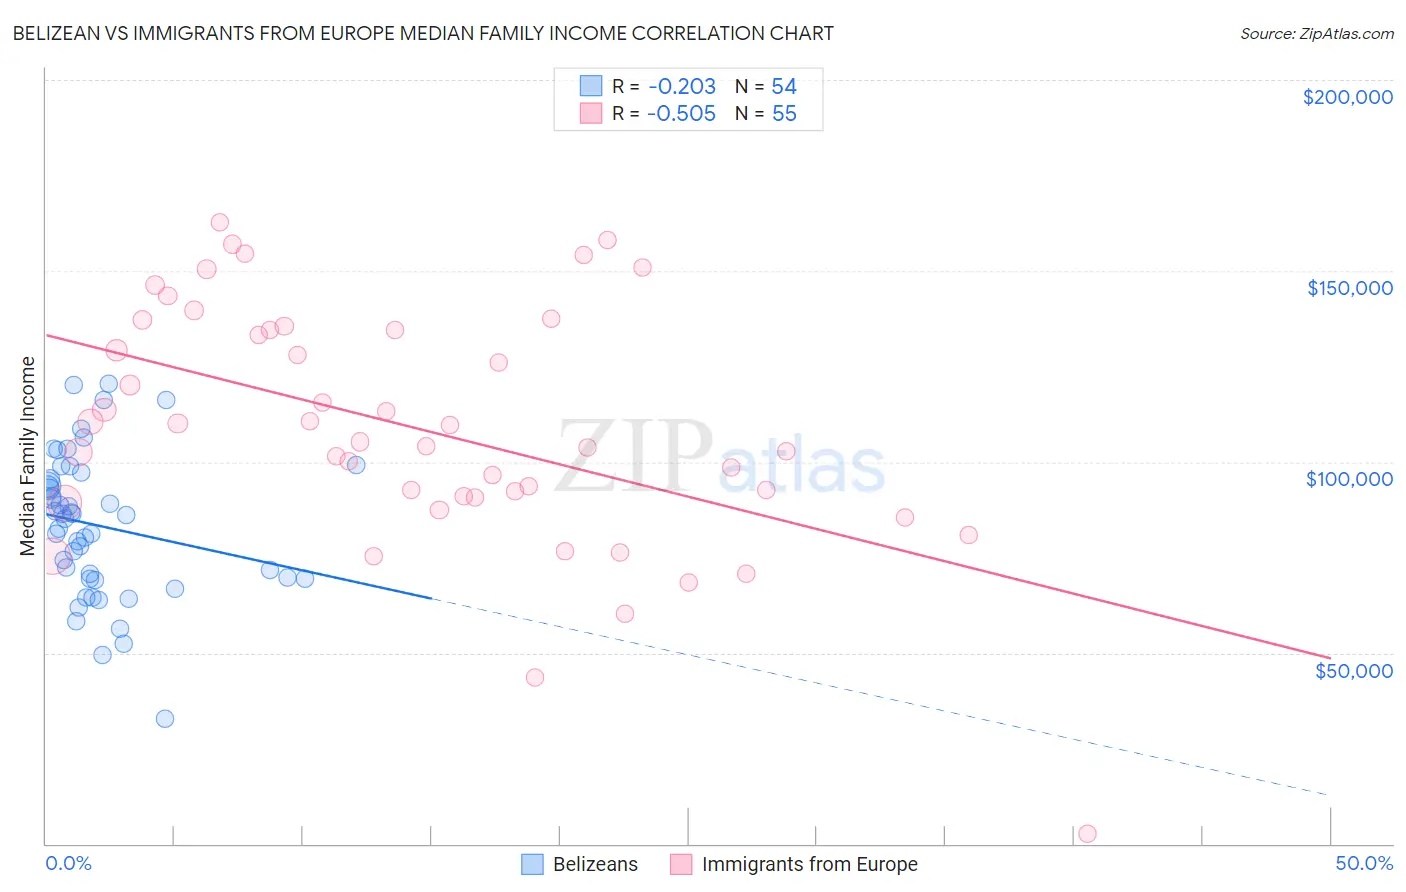
Belizean vs Immigrants from Europe Median Family Income Correlation Chart
The statistical analysis conducted on geographies consisting of 144,140,604 people shows a weak negative correlation between the proportion of Belizeans and median family income in the United States with a correlation coefficient (R) of -0.203 and weighted average of $90,880. Similarly, the statistical analysis conducted on geographies consisting of 546,465,722 people shows a substantial negative correlation between the proportion of Immigrants from Europe and median family income in the United States with a correlation coefficient (R) of -0.505 and weighted average of $115,523, a difference of 27.1%.
Median Family Income Correlation Summary
| Measurement | Belizean | Immigrants from Europe |
| Minimum | $32,813 | $2,499 |
| Maximum | $120,348 | $162,783 |
| Range | $87,535 | $160,284 |
| Mean | $83,217 | $108,657 |
| Median | $85,583 | $105,246 |
| Interquartile 25% (IQ1) | $69,412 | $90,625 |
| Interquartile 75% (IQ3) | $95,563 | $134,559 |
| Interquartile Range (IQR) | $26,151 | $43,934 |
| Standard Deviation (Sample) | $18,683 | $31,673 |
| Standard Deviation (Population) | $18,509 | $31,384 |
Similar Demographics by Median Family Income
Demographics Similar to Belizeans by Median Family Income
In terms of median family income, the demographic groups most similar to Belizeans are Cree ($90,882, a difference of 0.0%), Mexican American Indian ($90,918, a difference of 0.040%), Central American ($91,087, a difference of 0.23%), Jamaican ($90,581, a difference of 0.33%), and Iroquois ($90,543, a difference of 0.37%).
| Demographics | Rating | Rank | Median Family Income |
| Liberians | 0.4 /100 | #262 | Tragic $91,722 |
| Immigrants | West Indies | 0.3 /100 | #263 | Tragic $91,588 |
| Senegalese | 0.3 /100 | #264 | Tragic $91,475 |
| Hmong | 0.3 /100 | #265 | Tragic $91,296 |
| Central Americans | 0.3 /100 | #266 | Tragic $91,087 |
| Mexican American Indians | 0.2 /100 | #267 | Tragic $90,918 |
| Cree | 0.2 /100 | #268 | Tragic $90,882 |
| Belizeans | 0.2 /100 | #269 | Tragic $90,880 |
| Jamaicans | 0.2 /100 | #270 | Tragic $90,581 |
| Iroquois | 0.2 /100 | #271 | Tragic $90,543 |
| Immigrants | Liberia | 0.2 /100 | #272 | Tragic $90,450 |
| Immigrants | Micronesia | 0.2 /100 | #273 | Tragic $90,345 |
| Spanish Americans | 0.2 /100 | #274 | Tragic $90,322 |
| Immigrants | St. Vincent and the Grenadines | 0.2 /100 | #275 | Tragic $90,094 |
| Immigrants | Zaire | 0.1 /100 | #276 | Tragic $89,285 |
Demographics Similar to Immigrants from Europe by Median Family Income
In terms of median family income, the demographic groups most similar to Immigrants from Europe are Lithuanian ($115,395, a difference of 0.11%), New Zealander ($115,230, a difference of 0.25%), Immigrants from Norway ($115,847, a difference of 0.28%), Maltese ($115,862, a difference of 0.29%), and Greek ($115,192, a difference of 0.29%).
| Demographics | Rating | Rank | Median Family Income |
| Immigrants | Austria | 99.9 /100 | #47 | Exceptional $116,830 |
| Immigrants | South Africa | 99.9 /100 | #48 | Exceptional $116,286 |
| Chinese | 99.9 /100 | #49 | Exceptional $116,188 |
| Immigrants | Czechoslovakia | 99.9 /100 | #50 | Exceptional $116,165 |
| Immigrants | Malaysia | 99.9 /100 | #51 | Exceptional $115,880 |
| Maltese | 99.9 /100 | #52 | Exceptional $115,862 |
| Immigrants | Norway | 99.9 /100 | #53 | Exceptional $115,847 |
| Immigrants | Europe | 99.9 /100 | #54 | Exceptional $115,523 |
| Lithuanians | 99.8 /100 | #55 | Exceptional $115,395 |
| New Zealanders | 99.8 /100 | #56 | Exceptional $115,230 |
| Greeks | 99.8 /100 | #57 | Exceptional $115,192 |
| Immigrants | Indonesia | 99.8 /100 | #58 | Exceptional $115,162 |
| Immigrants | Netherlands | 99.8 /100 | #59 | Exceptional $114,987 |
| Immigrants | Latvia | 99.8 /100 | #60 | Exceptional $114,826 |
| Immigrants | Belarus | 99.8 /100 | #61 | Exceptional $114,586 |