Austrian vs Ugandan Per Capita Income
COMPARE
Austrian
Ugandan
Per Capita Income
Per Capita Income Comparison
Austrians
Ugandans
$48,116
PER CAPITA INCOME
99.3/ 100
METRIC RATING
85th/ 347
METRIC RANK
$45,047
PER CAPITA INCOME
82.6/ 100
METRIC RATING
142nd/ 347
METRIC RANK
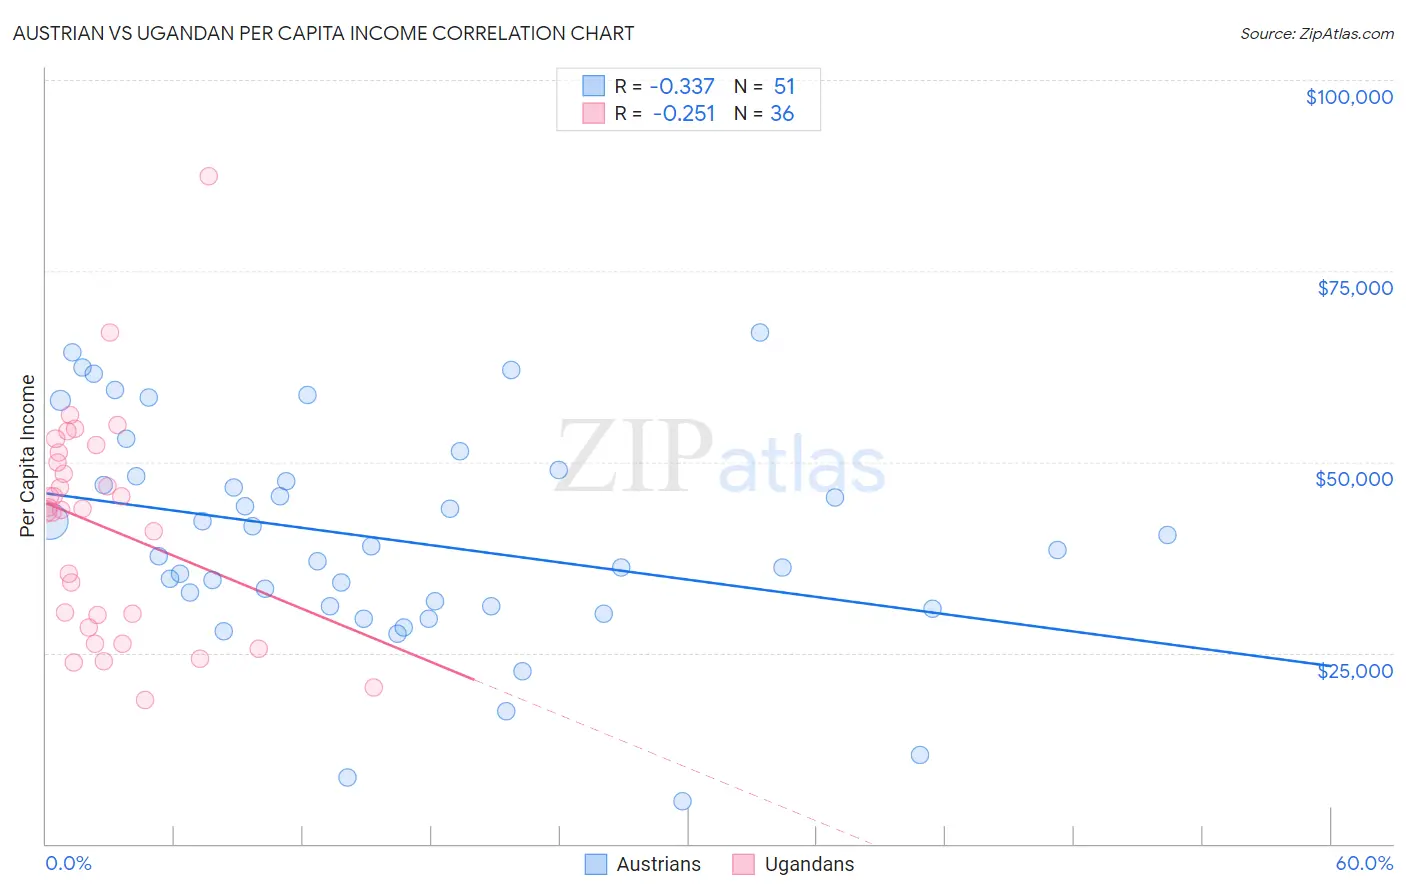
Austrian vs Ugandan Per Capita Income Correlation Chart
The statistical analysis conducted on geographies consisting of 452,103,489 people shows a mild negative correlation between the proportion of Austrians and per capita income in the United States with a correlation coefficient (R) of -0.337 and weighted average of $48,116. Similarly, the statistical analysis conducted on geographies consisting of 94,012,894 people shows a weak negative correlation between the proportion of Ugandans and per capita income in the United States with a correlation coefficient (R) of -0.251 and weighted average of $45,047, a difference of 6.8%.
Per Capita Income Correlation Summary
| Measurement | Austrian | Ugandan |
| Minimum | $5,500 | $18,741 |
| Maximum | $66,908 | $87,401 |
| Range | $61,408 | $68,660 |
| Mean | $39,852 | $41,524 |
| Median | $38,439 | $43,788 |
| Interquartile 25% (IQ1) | $31,067 | $29,158 |
| Interquartile 75% (IQ3) | $48,128 | $50,579 |
| Interquartile Range (IQR) | $17,061 | $21,420 |
| Standard Deviation (Sample) | $14,137 | $14,466 |
| Standard Deviation (Population) | $13,998 | $14,264 |
Similar Demographics by Per Capita Income
Demographics Similar to Austrians by Per Capita Income
In terms of per capita income, the demographic groups most similar to Austrians are Immigrants from Ukraine ($48,134, a difference of 0.040%), Immigrants from Brazil ($48,164, a difference of 0.10%), Immigrants from Indonesia ($48,195, a difference of 0.16%), Immigrants from Southern Europe ($48,027, a difference of 0.18%), and Ukrainian ($48,014, a difference of 0.21%).
| Demographics | Rating | Rank | Per Capita Income |
| Immigrants | Italy | 99.6 /100 | #78 | Exceptional $48,654 |
| Romanians | 99.5 /100 | #79 | Exceptional $48,445 |
| Egyptians | 99.5 /100 | #80 | Exceptional $48,358 |
| Armenians | 99.4 /100 | #81 | Exceptional $48,287 |
| Immigrants | Indonesia | 99.4 /100 | #82 | Exceptional $48,195 |
| Immigrants | Brazil | 99.4 /100 | #83 | Exceptional $48,164 |
| Immigrants | Ukraine | 99.3 /100 | #84 | Exceptional $48,134 |
| Austrians | 99.3 /100 | #85 | Exceptional $48,116 |
| Immigrants | Southern Europe | 99.3 /100 | #86 | Exceptional $48,027 |
| Ukrainians | 99.3 /100 | #87 | Exceptional $48,014 |
| Croatians | 99.0 /100 | #88 | Exceptional $47,742 |
| Northern Europeans | 98.9 /100 | #89 | Exceptional $47,698 |
| Italians | 98.8 /100 | #90 | Exceptional $47,574 |
| Macedonians | 98.8 /100 | #91 | Exceptional $47,573 |
| Immigrants | Moldova | 98.7 /100 | #92 | Exceptional $47,489 |
Demographics Similar to Ugandans by Per Capita Income
In terms of per capita income, the demographic groups most similar to Ugandans are Slavic ($45,049, a difference of 0.0%), Immigrants from Uganda ($45,043, a difference of 0.010%), Immigrants from Jordan ($45,066, a difference of 0.040%), Basque ($45,086, a difference of 0.090%), and Icelander ($44,987, a difference of 0.13%).
| Demographics | Rating | Rank | Per Capita Income |
| Hungarians | 87.9 /100 | #135 | Excellent $45,426 |
| Immigrants | Oceania | 85.2 /100 | #136 | Excellent $45,220 |
| Immigrants | Syria | 85.2 /100 | #137 | Excellent $45,218 |
| Assyrians/Chaldeans/Syriacs | 84.8 /100 | #138 | Excellent $45,195 |
| Basques | 83.2 /100 | #139 | Excellent $45,086 |
| Immigrants | Jordan | 82.9 /100 | #140 | Excellent $45,066 |
| Slavs | 82.6 /100 | #141 | Excellent $45,049 |
| Ugandans | 82.6 /100 | #142 | Excellent $45,047 |
| Immigrants | Uganda | 82.5 /100 | #143 | Excellent $45,043 |
| Icelanders | 81.6 /100 | #144 | Excellent $44,987 |
| Immigrants | Afghanistan | 78.0 /100 | #145 | Good $44,790 |
| Irish | 75.8 /100 | #146 | Good $44,679 |
| Czechs | 74.1 /100 | #147 | Good $44,595 |
| Immigrants | Armenia | 73.1 /100 | #148 | Good $44,552 |
| Koreans | 72.5 /100 | #149 | Good $44,522 |