Austrian vs Immigrants from Ireland Householder Income Ages 45 - 64 years
COMPARE
Austrian
Immigrants from Ireland
Householder Income Ages 45 - 64 years
Householder Income Ages 45 - 64 years Comparison
Austrians
Immigrants from Ireland
$108,692
HOUSEHOLDER INCOME AGES 45 - 64 YEARS
98.5/ 100
METRIC RATING
86th/ 347
METRIC RANK
$122,757
HOUSEHOLDER INCOME AGES 45 - 64 YEARS
100.0/ 100
METRIC RATING
13th/ 347
METRIC RANK
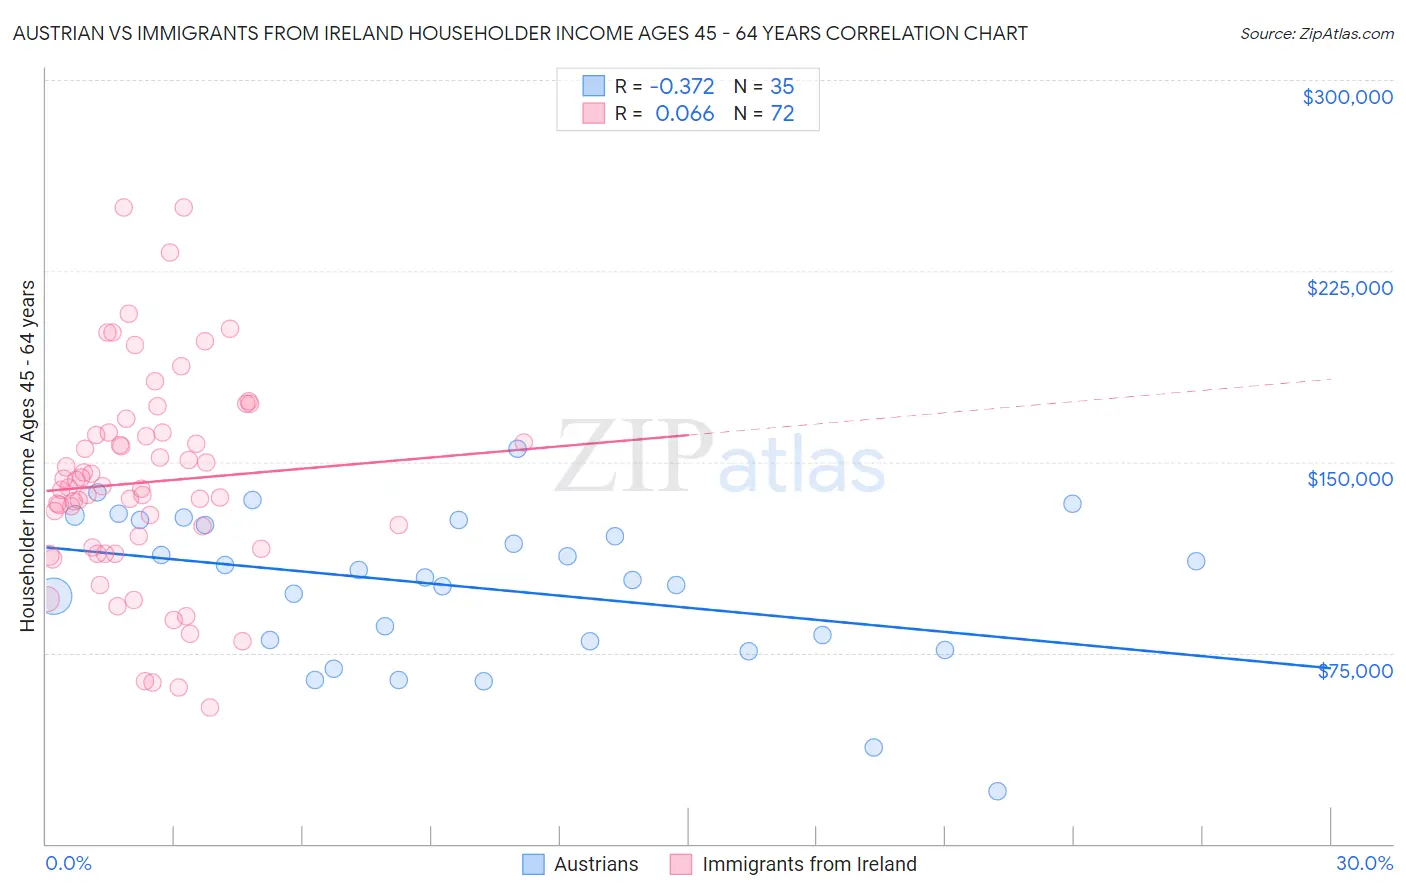
Austrian vs Immigrants from Ireland Householder Income Ages 45 - 64 years Correlation Chart
The statistical analysis conducted on geographies consisting of 451,173,379 people shows a mild negative correlation between the proportion of Austrians and household income with householder between the ages 45 and 64 in the United States with a correlation coefficient (R) of -0.372 and weighted average of $108,692. Similarly, the statistical analysis conducted on geographies consisting of 240,617,521 people shows a slight positive correlation between the proportion of Immigrants from Ireland and household income with householder between the ages 45 and 64 in the United States with a correlation coefficient (R) of 0.066 and weighted average of $122,757, a difference of 12.9%.
Householder Income Ages 45 - 64 years Correlation Summary
| Measurement | Austrian | Immigrants from Ireland |
| Minimum | $20,833 | $53,750 |
| Maximum | $155,000 | $250,001 |
| Range | $134,167 | $196,251 |
| Mean | $100,755 | $141,948 |
| Median | $104,463 | $139,768 |
| Interquartile 25% (IQ1) | $79,395 | $116,086 |
| Interquartile 75% (IQ3) | $126,954 | $161,016 |
| Interquartile Range (IQR) | $47,559 | $44,930 |
| Standard Deviation (Sample) | $29,820 | $40,881 |
| Standard Deviation (Population) | $29,391 | $40,596 |
Similar Demographics by Householder Income Ages 45 - 64 years
Demographics Similar to Austrians by Householder Income Ages 45 - 64 years
In terms of householder income ages 45 - 64 years, the demographic groups most similar to Austrians are Tongan ($108,643, a difference of 0.040%), Romanian ($108,609, a difference of 0.080%), Immigrants from Afghanistan ($108,785, a difference of 0.090%), Immigrants from Western Europe ($108,824, a difference of 0.12%), and Ukrainian ($108,475, a difference of 0.20%).
| Demographics | Rating | Rank | Householder Income Ages 45 - 64 years |
| Immigrants | Bulgaria | 98.9 /100 | #79 | Exceptional $109,379 |
| Jordanians | 98.9 /100 | #80 | Exceptional $109,376 |
| Immigrants | Eastern Europe | 98.9 /100 | #81 | Exceptional $109,335 |
| Immigrants | North America | 98.8 /100 | #82 | Exceptional $109,198 |
| Immigrants | Spain | 98.8 /100 | #83 | Exceptional $109,051 |
| Immigrants | Western Europe | 98.6 /100 | #84 | Exceptional $108,824 |
| Immigrants | Afghanistan | 98.6 /100 | #85 | Exceptional $108,785 |
| Austrians | 98.5 /100 | #86 | Exceptional $108,692 |
| Tongans | 98.5 /100 | #87 | Exceptional $108,643 |
| Romanians | 98.5 /100 | #88 | Exceptional $108,609 |
| Ukrainians | 98.3 /100 | #89 | Exceptional $108,475 |
| Immigrants | Philippines | 98.3 /100 | #90 | Exceptional $108,471 |
| Immigrants | Lebanon | 98.3 /100 | #91 | Exceptional $108,471 |
| Croatians | 98.3 /100 | #92 | Exceptional $108,383 |
| Immigrants | Croatia | 98.2 /100 | #93 | Exceptional $108,304 |
Demographics Similar to Immigrants from Ireland by Householder Income Ages 45 - 64 years
In terms of householder income ages 45 - 64 years, the demographic groups most similar to Immigrants from Ireland are Immigrants from Israel ($122,893, a difference of 0.11%), Indian (Asian) ($122,343, a difference of 0.34%), Immigrants from Eastern Asia ($122,222, a difference of 0.44%), Immigrants from China ($122,178, a difference of 0.47%), and Cypriot ($123,396, a difference of 0.52%).
| Demographics | Rating | Rank | Householder Income Ages 45 - 64 years |
| Iranians | 100.0 /100 | #6 | Exceptional $129,350 |
| Immigrants | Hong Kong | 100.0 /100 | #7 | Exceptional $127,500 |
| Immigrants | Iran | 100.0 /100 | #8 | Exceptional $126,940 |
| Okinawans | 100.0 /100 | #9 | Exceptional $124,796 |
| Immigrants | South Central Asia | 100.0 /100 | #10 | Exceptional $124,188 |
| Cypriots | 100.0 /100 | #11 | Exceptional $123,396 |
| Immigrants | Israel | 100.0 /100 | #12 | Exceptional $122,893 |
| Immigrants | Ireland | 100.0 /100 | #13 | Exceptional $122,757 |
| Indians (Asian) | 100.0 /100 | #14 | Exceptional $122,343 |
| Immigrants | Eastern Asia | 100.0 /100 | #15 | Exceptional $122,222 |
| Immigrants | China | 100.0 /100 | #16 | Exceptional $122,178 |
| Burmese | 100.0 /100 | #17 | Exceptional $121,444 |
| Immigrants | Korea | 100.0 /100 | #18 | Exceptional $121,243 |
| Eastern Europeans | 100.0 /100 | #19 | Exceptional $120,684 |
| Immigrants | Australia | 100.0 /100 | #20 | Exceptional $119,308 |