Armenian vs Immigrants from Dominica Median Earnings
COMPARE
Armenian
Immigrants from Dominica
Median Earnings
Median Earnings Comparison
Armenians
Immigrants from Dominica
$49,804
MEDIAN EARNINGS
99.1/ 100
METRIC RATING
93rd/ 347
METRIC RANK
$42,420
MEDIAN EARNINGS
0.4/ 100
METRIC RATING
273rd/ 347
METRIC RANK
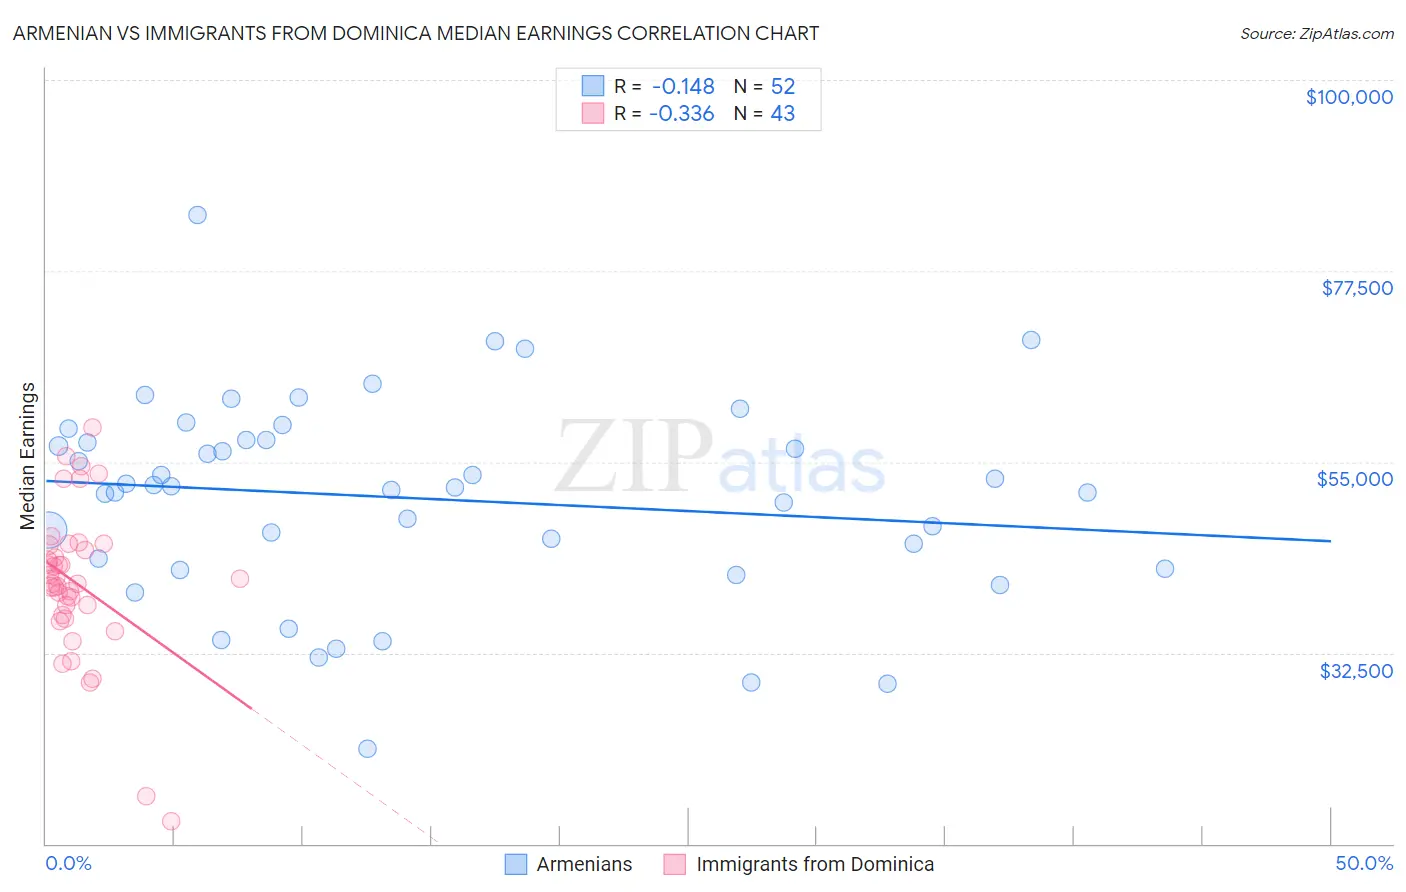
Armenian vs Immigrants from Dominica Median Earnings Correlation Chart
The statistical analysis conducted on geographies consisting of 310,945,861 people shows a poor negative correlation between the proportion of Armenians and median earnings in the United States with a correlation coefficient (R) of -0.148 and weighted average of $49,804. Similarly, the statistical analysis conducted on geographies consisting of 83,794,141 people shows a mild negative correlation between the proportion of Immigrants from Dominica and median earnings in the United States with a correlation coefficient (R) of -0.336 and weighted average of $42,420, a difference of 17.4%.
Median Earnings Correlation Summary
| Measurement | Armenian | Immigrants from Dominica |
| Minimum | $21,250 | $12,717 |
| Maximum | $84,019 | $59,056 |
| Range | $62,769 | $46,339 |
| Mean | $50,725 | $40,644 |
| Median | $52,028 | $40,628 |
| Interquartile 25% (IQ1) | $43,022 | $36,948 |
| Interquartile 75% (IQ3) | $57,580 | $45,188 |
| Interquartile Range (IQR) | $14,558 | $8,240 |
| Standard Deviation (Sample) | $11,922 | $8,982 |
| Standard Deviation (Population) | $11,807 | $8,876 |
Similar Demographics by Median Earnings
Demographics Similar to Armenians by Median Earnings
In terms of median earnings, the demographic groups most similar to Armenians are Immigrants from Argentina ($49,841, a difference of 0.070%), Croatian ($49,724, a difference of 0.16%), Immigrants from England ($49,722, a difference of 0.16%), Macedonian ($49,893, a difference of 0.18%), and Italian ($49,915, a difference of 0.22%).
| Demographics | Rating | Rank | Median Earnings |
| Immigrants | Canada | 99.5 /100 | #86 | Exceptional $50,192 |
| Immigrants | Uzbekistan | 99.5 /100 | #87 | Exceptional $50,151 |
| Albanians | 99.4 /100 | #88 | Exceptional $50,116 |
| Immigrants | North America | 99.4 /100 | #89 | Exceptional $50,108 |
| Italians | 99.3 /100 | #90 | Exceptional $49,915 |
| Macedonians | 99.2 /100 | #91 | Exceptional $49,893 |
| Immigrants | Argentina | 99.2 /100 | #92 | Exceptional $49,841 |
| Armenians | 99.1 /100 | #93 | Exceptional $49,804 |
| Croatians | 99.0 /100 | #94 | Exceptional $49,724 |
| Immigrants | England | 99.0 /100 | #95 | Exceptional $49,722 |
| Immigrants | Lebanon | 99.0 /100 | #96 | Exceptional $49,682 |
| Immigrants | North Macedonia | 98.9 /100 | #97 | Exceptional $49,658 |
| Immigrants | Northern Africa | 98.9 /100 | #98 | Exceptional $49,648 |
| Immigrants | Afghanistan | 98.9 /100 | #99 | Exceptional $49,645 |
| Immigrants | Poland | 98.9 /100 | #100 | Exceptional $49,633 |
Demographics Similar to Immigrants from Dominica by Median Earnings
In terms of median earnings, the demographic groups most similar to Immigrants from Dominica are Immigrants from El Salvador ($42,413, a difference of 0.020%), Iroquois ($42,430, a difference of 0.030%), Immigrants from Belize ($42,339, a difference of 0.19%), Spanish American ($42,316, a difference of 0.25%), and Central American ($42,280, a difference of 0.33%).
| Demographics | Rating | Rank | Median Earnings |
| Immigrants | Laos | 0.7 /100 | #266 | Tragic $42,884 |
| Cree | 0.6 /100 | #267 | Tragic $42,777 |
| Americans | 0.6 /100 | #268 | Tragic $42,742 |
| Belizeans | 0.5 /100 | #269 | Tragic $42,702 |
| Osage | 0.5 /100 | #270 | Tragic $42,651 |
| Pennsylvania Germans | 0.5 /100 | #271 | Tragic $42,615 |
| Iroquois | 0.4 /100 | #272 | Tragic $42,430 |
| Immigrants | Dominica | 0.4 /100 | #273 | Tragic $42,420 |
| Immigrants | El Salvador | 0.4 /100 | #274 | Tragic $42,413 |
| Immigrants | Belize | 0.3 /100 | #275 | Tragic $42,339 |
| Spanish Americans | 0.3 /100 | #276 | Tragic $42,316 |
| Central Americans | 0.3 /100 | #277 | Tragic $42,280 |
| Cajuns | 0.3 /100 | #278 | Tragic $42,189 |
| Colville | 0.2 /100 | #279 | Tragic $42,151 |
| Hmong | 0.2 /100 | #280 | Tragic $42,111 |