Argentinean vs Immigrants from Denmark Median Family Income
COMPARE
Argentinean
Immigrants from Denmark
Median Family Income
Median Family Income Comparison
Argentineans
Immigrants from Denmark
$112,665
MEDIAN FAMILY INCOME
99.4/ 100
METRIC RATING
76th/ 347
METRIC RANK
$120,445
MEDIAN FAMILY INCOME
100.0/ 100
METRIC RATING
28th/ 347
METRIC RANK
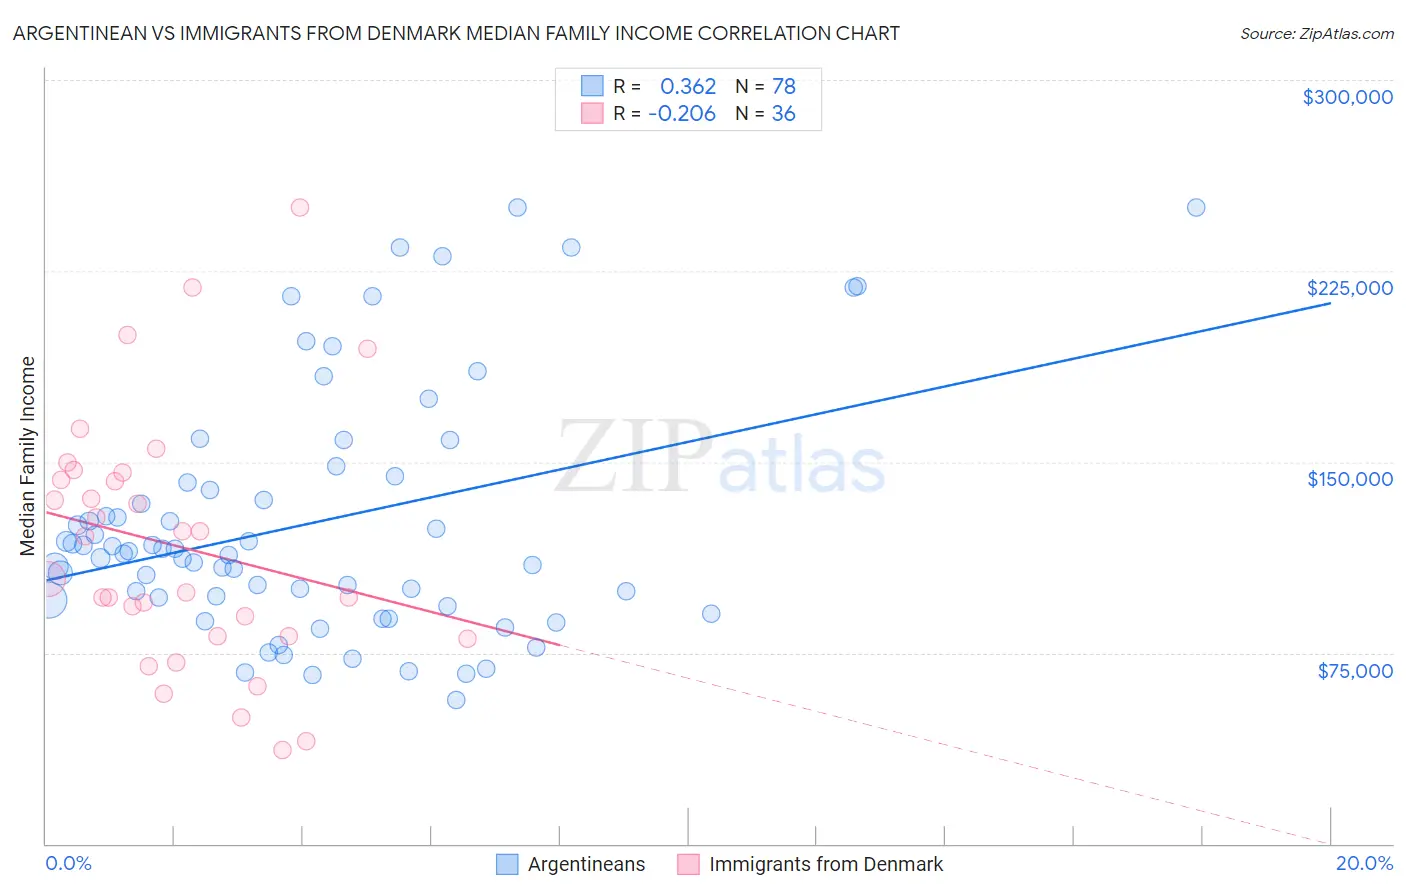
Argentinean vs Immigrants from Denmark Median Family Income Correlation Chart
The statistical analysis conducted on geographies consisting of 296,932,398 people shows a mild positive correlation between the proportion of Argentineans and median family income in the United States with a correlation coefficient (R) of 0.362 and weighted average of $112,665. Similarly, the statistical analysis conducted on geographies consisting of 136,397,640 people shows a weak negative correlation between the proportion of Immigrants from Denmark and median family income in the United States with a correlation coefficient (R) of -0.206 and weighted average of $120,445, a difference of 6.9%.
Median Family Income Correlation Summary
| Measurement | Argentinean | Immigrants from Denmark |
| Minimum | $56,696 | $36,611 |
| Maximum | $250,001 | $250,001 |
| Range | $193,305 | $213,390 |
| Mean | $126,035 | $116,902 |
| Median | $114,562 | $112,401 |
| Interquartile 25% (IQ1) | $95,780 | $81,504 |
| Interquartile 75% (IQ3) | $141,982 | $144,309 |
| Interquartile Range (IQR) | $46,202 | $62,805 |
| Standard Deviation (Sample) | $48,159 | $49,223 |
| Standard Deviation (Population) | $47,849 | $48,535 |
Similar Demographics by Median Family Income
Demographics Similar to Argentineans by Median Family Income
In terms of median family income, the demographic groups most similar to Argentineans are Immigrants from Western Europe ($112,688, a difference of 0.020%), Immigrants from Eastern Europe ($112,527, a difference of 0.12%), Immigrants from Italy ($112,848, a difference of 0.16%), Laotian ($112,859, a difference of 0.17%), and Immigrants from Canada ($112,374, a difference of 0.26%).
| Demographics | Rating | Rank | Median Family Income |
| Immigrants | Bulgaria | 99.6 /100 | #69 | Exceptional $113,461 |
| Immigrants | Romania | 99.6 /100 | #70 | Exceptional $113,434 |
| South Africans | 99.5 /100 | #71 | Exceptional $113,229 |
| Afghans | 99.5 /100 | #72 | Exceptional $112,971 |
| Laotians | 99.5 /100 | #73 | Exceptional $112,859 |
| Immigrants | Italy | 99.4 /100 | #74 | Exceptional $112,848 |
| Immigrants | Western Europe | 99.4 /100 | #75 | Exceptional $112,688 |
| Argentineans | 99.4 /100 | #76 | Exceptional $112,665 |
| Immigrants | Eastern Europe | 99.4 /100 | #77 | Exceptional $112,527 |
| Immigrants | Canada | 99.3 /100 | #78 | Exceptional $112,374 |
| Italians | 99.3 /100 | #79 | Exceptional $112,372 |
| Immigrants | Croatia | 99.3 /100 | #80 | Exceptional $112,323 |
| Immigrants | North America | 99.2 /100 | #81 | Exceptional $112,151 |
| Immigrants | England | 99.2 /100 | #82 | Exceptional $112,038 |
| Immigrants | Egypt | 99.0 /100 | #83 | Exceptional $111,689 |
Demographics Similar to Immigrants from Denmark by Median Family Income
In terms of median family income, the demographic groups most similar to Immigrants from Denmark are Russian ($120,487, a difference of 0.040%), Latvian ($120,301, a difference of 0.12%), Immigrants from Sri Lanka ($120,263, a difference of 0.15%), Immigrants from Switzerland ($120,726, a difference of 0.23%), and Immigrants from France ($120,076, a difference of 0.31%).
| Demographics | Rating | Rank | Median Family Income |
| Immigrants | Korea | 100.0 /100 | #21 | Exceptional $122,800 |
| Immigrants | Sweden | 100.0 /100 | #22 | Exceptional $122,765 |
| Immigrants | Japan | 100.0 /100 | #23 | Exceptional $122,764 |
| Immigrants | Northern Europe | 100.0 /100 | #24 | Exceptional $121,840 |
| Turks | 100.0 /100 | #25 | Exceptional $121,202 |
| Immigrants | Switzerland | 100.0 /100 | #26 | Exceptional $120,726 |
| Russians | 100.0 /100 | #27 | Exceptional $120,487 |
| Immigrants | Denmark | 100.0 /100 | #28 | Exceptional $120,445 |
| Latvians | 100.0 /100 | #29 | Exceptional $120,301 |
| Immigrants | Sri Lanka | 100.0 /100 | #30 | Exceptional $120,263 |
| Immigrants | France | 100.0 /100 | #31 | Exceptional $120,076 |
| Asians | 100.0 /100 | #32 | Exceptional $119,955 |
| Bhutanese | 100.0 /100 | #33 | Exceptional $119,800 |
| Bolivians | 100.0 /100 | #34 | Exceptional $119,479 |
| Soviet Union | 100.0 /100 | #35 | Exceptional $119,262 |