Arab vs Bolivian Householder Income Over 65 years
COMPARE
Arab
Bolivian
Householder Income Over 65 years
Householder Income Over 65 years Comparison
Arabs
Bolivians
$62,266
HOUSEHOLDER INCOME OVER 65 YEARS
79.6/ 100
METRIC RATING
140th/ 347
METRIC RANK
$74,245
HOUSEHOLDER INCOME OVER 65 YEARS
100.0/ 100
METRIC RATING
6th/ 347
METRIC RANK
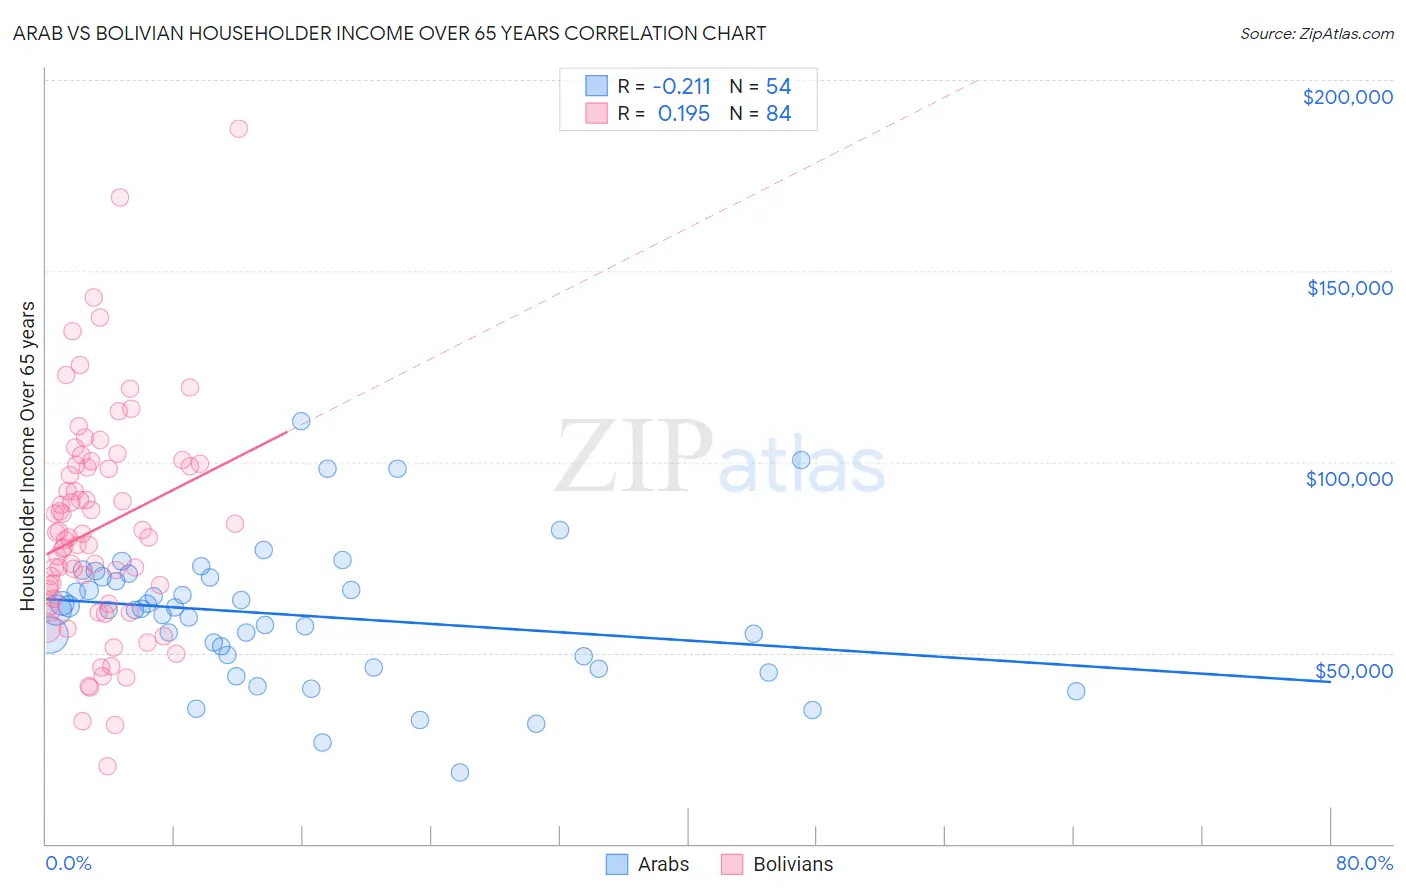
Arab vs Bolivian Householder Income Over 65 years Correlation Chart
The statistical analysis conducted on geographies consisting of 484,580,257 people shows a weak negative correlation between the proportion of Arabs and household income with householder over the age of 65 in the United States with a correlation coefficient (R) of -0.211 and weighted average of $62,266. Similarly, the statistical analysis conducted on geographies consisting of 184,404,037 people shows a poor positive correlation between the proportion of Bolivians and household income with householder over the age of 65 in the United States with a correlation coefficient (R) of 0.195 and weighted average of $74,245, a difference of 19.2%.
Householder Income Over 65 years Correlation Summary
| Measurement | Arab | Bolivian |
| Minimum | $18,625 | $20,142 |
| Maximum | $110,553 | $187,273 |
| Range | $91,928 | $167,131 |
| Mean | $59,915 | $82,611 |
| Median | $61,186 | $80,185 |
| Interquartile 25% (IQ1) | $48,984 | $63,404 |
| Interquartile 75% (IQ3) | $69,644 | $98,957 |
| Interquartile Range (IQR) | $20,660 | $35,553 |
| Standard Deviation (Sample) | $18,146 | $29,052 |
| Standard Deviation (Population) | $17,978 | $28,879 |
Similar Demographics by Householder Income Over 65 years
Demographics Similar to Arabs by Householder Income Over 65 years
In terms of householder income over 65 years, the demographic groups most similar to Arabs are Lebanese ($62,287, a difference of 0.030%), Immigrants from Kazakhstan ($62,292, a difference of 0.040%), Immigrants from Syria ($62,303, a difference of 0.060%), Canadian ($62,230, a difference of 0.060%), and South American Indian ($62,215, a difference of 0.080%).
| Demographics | Rating | Rank | Householder Income Over 65 years |
| Immigrants | Northern Africa | 83.6 /100 | #133 | Excellent $62,522 |
| Immigrants | Brazil | 81.2 /100 | #134 | Excellent $62,364 |
| Immigrants | Chile | 81.0 /100 | #135 | Excellent $62,354 |
| Alaskan Athabascans | 80.6 /100 | #136 | Excellent $62,330 |
| Immigrants | Syria | 80.2 /100 | #137 | Excellent $62,303 |
| Immigrants | Kazakhstan | 80.0 /100 | #138 | Excellent $62,292 |
| Lebanese | 79.9 /100 | #139 | Good $62,287 |
| Arabs | 79.6 /100 | #140 | Good $62,266 |
| Canadians | 79.0 /100 | #141 | Good $62,230 |
| South American Indians | 78.7 /100 | #142 | Good $62,215 |
| Immigrants | Belarus | 77.8 /100 | #143 | Good $62,162 |
| Immigrants | Peru | 74.4 /100 | #144 | Good $61,988 |
| Immigrants | Uganda | 74.2 /100 | #145 | Good $61,976 |
| Immigrants | Southern Europe | 72.7 /100 | #146 | Good $61,902 |
| Immigrants | Nepal | 71.4 /100 | #147 | Good $61,843 |
Demographics Similar to Bolivians by Householder Income Over 65 years
In terms of householder income over 65 years, the demographic groups most similar to Bolivians are Immigrants from Bolivia ($73,434, a difference of 1.1%), Immigrants from Iran ($75,081, a difference of 1.1%), Immigrants from Singapore ($72,963, a difference of 1.8%), Immigrants from India ($72,804, a difference of 2.0%), and Bhutanese ($72,288, a difference of 2.7%).
| Demographics | Rating | Rank | Householder Income Over 65 years |
| Chinese | 100.0 /100 | #1 | Exceptional $77,465 |
| Iranians | 100.0 /100 | #2 | Exceptional $77,429 |
| Immigrants | Taiwan | 100.0 /100 | #3 | Exceptional $77,051 |
| Filipinos | 100.0 /100 | #4 | Exceptional $76,686 |
| Immigrants | Iran | 100.0 /100 | #5 | Exceptional $75,081 |
| Bolivians | 100.0 /100 | #6 | Exceptional $74,245 |
| Immigrants | Bolivia | 100.0 /100 | #7 | Exceptional $73,434 |
| Immigrants | Singapore | 100.0 /100 | #8 | Exceptional $72,963 |
| Immigrants | India | 100.0 /100 | #9 | Exceptional $72,804 |
| Bhutanese | 100.0 /100 | #10 | Exceptional $72,288 |
| Thais | 100.0 /100 | #11 | Exceptional $72,099 |
| Cypriots | 100.0 /100 | #12 | Exceptional $71,714 |
| Immigrants | Hong Kong | 100.0 /100 | #13 | Exceptional $71,567 |
| Burmese | 100.0 /100 | #14 | Exceptional $71,139 |
| Native Hawaiians | 100.0 /100 | #15 | Exceptional $71,021 |