American vs Chilean Median Family Income
COMPARE
American
Chilean
Median Family Income
Median Family Income Comparison
Americans
Chileans
$92,096
MEDIAN FAMILY INCOME
0.4/ 100
METRIC RATING
257th/ 347
METRIC RANK
$108,429
MEDIAN FAMILY INCOME
95.0/ 100
METRIC RATING
116th/ 347
METRIC RANK
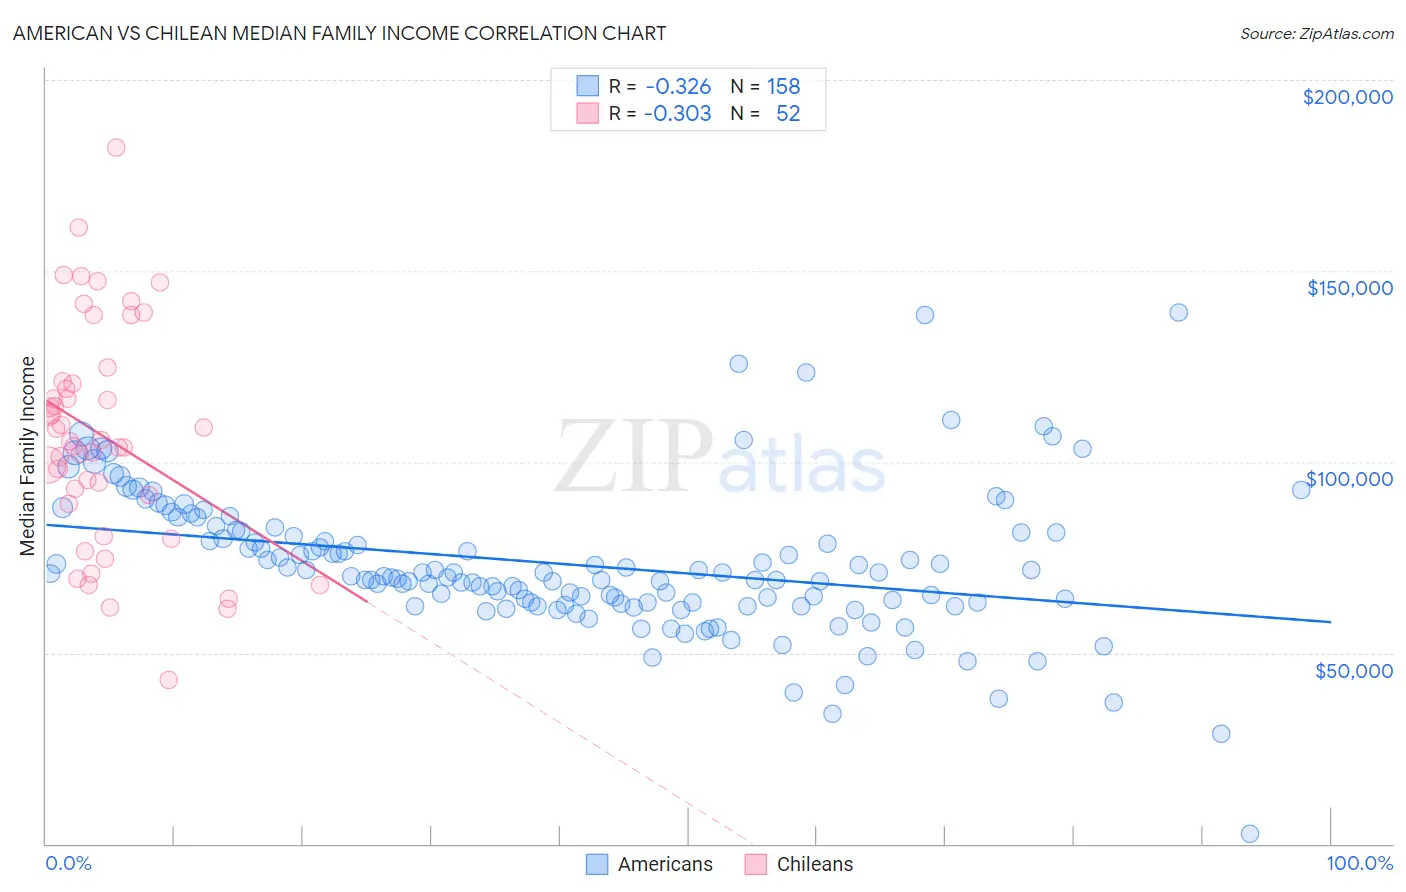
American vs Chilean Median Family Income Correlation Chart
The statistical analysis conducted on geographies consisting of 580,248,843 people shows a mild negative correlation between the proportion of Americans and median family income in the United States with a correlation coefficient (R) of -0.326 and weighted average of $92,096. Similarly, the statistical analysis conducted on geographies consisting of 256,482,123 people shows a mild negative correlation between the proportion of Chileans and median family income in the United States with a correlation coefficient (R) of -0.303 and weighted average of $108,429, a difference of 17.7%.
Median Family Income Correlation Summary
| Measurement | American | Chilean |
| Minimum | $2,499 | $42,833 |
| Maximum | $139,235 | $182,212 |
| Range | $136,736 | $139,379 |
| Mean | $73,235 | $106,873 |
| Median | $70,309 | $105,526 |
| Interquartile 25% (IQ1) | $63,060 | $90,247 |
| Interquartile 75% (IQ3) | $81,871 | $120,874 |
| Interquartile Range (IQR) | $18,811 | $30,627 |
| Standard Deviation (Sample) | $18,957 | $28,929 |
| Standard Deviation (Population) | $18,897 | $28,649 |
Similar Demographics by Median Family Income
Demographics Similar to Americans by Median Family Income
In terms of median family income, the demographic groups most similar to Americans are Nicaraguan ($92,231, a difference of 0.15%), Immigrants from Laos ($92,239, a difference of 0.16%), Osage ($91,926, a difference of 0.19%), Cape Verdean ($91,848, a difference of 0.27%), and Immigrants from Barbados ($92,419, a difference of 0.35%).
| Demographics | Rating | Rank | Median Family Income |
| West Indians | 0.6 /100 | #250 | Tragic $92,765 |
| Immigrants | Somalia | 0.6 /100 | #251 | Tragic $92,609 |
| Immigrants | El Salvador | 0.6 /100 | #252 | Tragic $92,545 |
| Immigrants | Guyana | 0.6 /100 | #253 | Tragic $92,513 |
| Immigrants | Barbados | 0.5 /100 | #254 | Tragic $92,419 |
| Immigrants | Laos | 0.5 /100 | #255 | Tragic $92,239 |
| Nicaraguans | 0.5 /100 | #256 | Tragic $92,231 |
| Americans | 0.4 /100 | #257 | Tragic $92,096 |
| Osage | 0.4 /100 | #258 | Tragic $91,926 |
| Cape Verdeans | 0.4 /100 | #259 | Tragic $91,848 |
| Pennsylvania Germans | 0.4 /100 | #260 | Tragic $91,763 |
| Inupiat | 0.4 /100 | #261 | Tragic $91,730 |
| Liberians | 0.4 /100 | #262 | Tragic $91,722 |
| Immigrants | West Indies | 0.3 /100 | #263 | Tragic $91,588 |
| Senegalese | 0.3 /100 | #264 | Tragic $91,475 |
Demographics Similar to Chileans by Median Family Income
In terms of median family income, the demographic groups most similar to Chileans are Swedish ($108,499, a difference of 0.060%), Polish ($108,507, a difference of 0.070%), Immigrants from Saudi Arabia ($108,544, a difference of 0.11%), Immigrants from Poland ($108,570, a difference of 0.13%), and Immigrants from Philippines ($108,288, a difference of 0.13%).
| Demographics | Rating | Rank | Median Family Income |
| Immigrants | Afghanistan | 95.6 /100 | #109 | Exceptional $108,709 |
| British | 95.6 /100 | #110 | Exceptional $108,705 |
| Immigrants | Western Asia | 95.6 /100 | #111 | Exceptional $108,691 |
| Immigrants | Poland | 95.3 /100 | #112 | Exceptional $108,570 |
| Immigrants | Saudi Arabia | 95.2 /100 | #113 | Exceptional $108,544 |
| Poles | 95.2 /100 | #114 | Exceptional $108,507 |
| Swedes | 95.1 /100 | #115 | Exceptional $108,499 |
| Chileans | 95.0 /100 | #116 | Exceptional $108,429 |
| Immigrants | Philippines | 94.6 /100 | #117 | Exceptional $108,288 |
| Ethiopians | 94.5 /100 | #118 | Exceptional $108,251 |
| Sri Lankans | 94.5 /100 | #119 | Exceptional $108,234 |
| Immigrants | Northern Africa | 94.3 /100 | #120 | Exceptional $108,161 |
| Europeans | 94.1 /100 | #121 | Exceptional $108,099 |
| Immigrants | Jordan | 92.9 /100 | #122 | Exceptional $107,715 |
| Carpatho Rusyns | 92.2 /100 | #123 | Exceptional $107,502 |