Alsatian vs Finnish Householder Income Over 65 years

COMPARE

Alsatian
Race
Ancestry
AfghanAfricanAlaska NativeAlaskan AthabascanAlbanianAleutAlsatianAmericanApacheArabArapahoArgentineanArmenianAssyrian/Chaldean/SyriacAustralianAustrianBahamianBangladeshiBarbadianBasqueBelgianBelizeanBermudanBhutaneseBlackfeetBolivianBrazilianBritishBritish West IndianBulgarianBurmeseCajunCambodianCanadianCape VerdeanCarpatho RusynCelticCentral AmericanCentral American IndianCherokeeCheyenneChickasawChileanChineseChippewaChoctawColombianColvilleComancheCosta RicanCreeCreekCroatianCrowCubanCypriotCzechCzechoslovakianDanishDelawareDominicanDutchDutch West IndianEastern EuropeanEcuadorianEgyptianEnglishEstonianEthiopianEuropeanFijianFilipinoFrenchFrench American IndianFrench CanadianGermanGerman RussianGhanaianGreekGuamanian/ChamorroGuatemalanGuyaneseHaitianHmongHonduranHopiHoumaHungarianIcelanderIndian (Asian)IndonesianInupiatIranianIraqiIrishIroquoisIsraeliItalianJamaicanJapaneseJordanianKenyanKiowaKoreanLaotianLatvianLebaneseLiberianLithuanianLumbeeLuxembourgerMacedonianMalaysianMalteseMarshalleseMenomineeMexicanMexican American IndianMongolianMoroccanNative HawaiianNavajoNepaleseNew ZealanderNicaraguanNigerianNorthern EuropeanNorwegianOkinawanOsageOttawaPaiutePakistaniPalestinianPanamanianParaguayanPennsylvania GermanPeruvianPimaPolishPortuguesePotawatomiPuebloPuerto RicanPuget Sound SalishRomanianRussianSalvadoranSamoanScandinavianScotch-IrishScottishSeminoleSenegaleseSerbianShoshoneSierra LeoneanSiouxSlavicSlovakSloveneSomaliSouth AfricanSouth AmericanSouth American IndianSoviet UnionSpaniardSpanishSpanish AmericanSpanish American IndianSri LankanSubsaharan AfricanSudaneseSwedishSwissSyrianTaiwaneseThaiTlingit-HaidaTohono O'OdhamTonganTrinidadian and TobagonianTsimshianTurkishU.S. Virgin IslanderUgandanUkrainianUruguayanUteVenezuelanVietnameseWelshWest IndianYakamaYaquiYugoslavianYumanYup'ikZimbabwean
Immigration
NonimmigrantsImmigrantsAfghanistanAfricaAlbaniaArgentinaArmeniaAsiaAustraliaAustriaBahamasBangladeshBarbadosBelarusBelgiumBelizeBoliviaBosnia and HerzegovinaBrazilBulgariaBurma/MyanmarCabo VerdeCambodiaCameroonCanadaCaribbeanCentral AmericaChileChinaColombiaCongoCosta RicaCroatiaCubaCzechoslovakiaDenmarkDominicaDominican RepublicEastern AfricaEastern AsiaEastern EuropeEcuadorEgyptEl SalvadorEnglandEritreaEthiopiaEuropeFijiFranceGermanyGhanaGreeceGrenadaGuatemalaGuyanaHaitiHondurasHong KongHungaryIndiaIndonesiaIranIraqIrelandIsraelItalyJamaicaJapanJordanKazakhstanKenyaKoreaKuwaitLaosLatin AmericaLatviaLebanonLiberiaLithuaniaMalaysiaMexicoMicronesiaMiddle AfricaMoldovaMoroccoNepalNetherlandsNicaraguaNigeriaNorth AmericaNorth MacedoniaNorthern AfricaNorthern EuropeNorwayOceaniaPakistanPanamaPeruPhilippinesPolandPortugalRomaniaRussiaSaudi ArabiaScotlandSenegalSerbiaSierra LeoneSingaporeSomaliaSouth AfricaSouth AmericaSouth Central AsiaSouth Eastern AsiaSouthern EuropeSpainSri LankaSt. Vincent and the GrenadinesSudanSwedenSwitzerlandSyriaTaiwanThailandTrinidad and TobagoTurkeyUgandaUkraineUruguayUzbekistanVenezuelaVietnamWest IndiesWestern AfricaWestern AsiaWestern EuropeYemenZaireZimbabweAzores
Finnish
Race
Ancestry
AfghanAfricanAlaska NativeAlaskan AthabascanAlbanianAleutAmericanApacheArabArapahoArgentineanArmenianAssyrian/Chaldean/SyriacAustralianAustrianBahamianBangladeshiBarbadianBasqueBelgianBelizeanBermudanBhutaneseBlackfeetBolivianBrazilianBritishBritish West IndianBulgarianBurmeseCajunCambodianCanadianCape VerdeanCarpatho RusynCelticCentral AmericanCentral American IndianCherokeeCheyenneChickasawChileanChineseChippewaChoctawColombianColvilleComancheCosta RicanCreeCreekCroatianCrowCubanCypriotCzechCzechoslovakianDanishDelawareDominicanDutchDutch West IndianEastern EuropeanEcuadorianEgyptianEnglishEstonianEthiopianEuropeanFijianFilipinoFinnishFrenchFrench American IndianFrench CanadianGermanGerman RussianGhanaianGreekGuamanian/ChamorroGuatemalanGuyaneseHaitianHmongHonduranHopiHoumaHungarianIcelanderIndian (Asian)IndonesianInupiatIranianIraqiIrishIroquoisIsraeliItalianJamaicanJapaneseJordanianKenyanKiowaKoreanLaotianLatvianLebaneseLiberianLithuanianLumbeeLuxembourgerMacedonianMalaysianMalteseMarshalleseMenomineeMexicanMexican American IndianMongolianMoroccanNative HawaiianNavajoNepaleseNew ZealanderNicaraguanNigerianNorthern EuropeanNorwegianOkinawanOsageOttawaPaiutePakistaniPalestinianPanamanianParaguayanPennsylvania GermanPeruvianPimaPolishPortuguesePotawatomiPuebloPuerto RicanPuget Sound SalishRomanianRussianSalvadoranSamoanScandinavianScotch-IrishScottishSeminoleSenegaleseSerbianShoshoneSierra LeoneanSiouxSlavicSlovakSloveneSomaliSouth AfricanSouth AmericanSouth American IndianSoviet UnionSpaniardSpanishSpanish AmericanSpanish American IndianSri LankanSubsaharan AfricanSudaneseSwedishSwissSyrianTaiwaneseThaiTlingit-HaidaTohono O'OdhamTonganTrinidadian and TobagonianTsimshianTurkishU.S. Virgin IslanderUgandanUkrainianUruguayanUteVenezuelanVietnameseWelshWest IndianYakamaYaquiYugoslavianYumanYup'ikZimbabwean
Immigration
NonimmigrantsImmigrantsAfghanistanAfricaAlbaniaArgentinaArmeniaAsiaAustraliaAustriaBahamasBangladeshBarbadosBelarusBelgiumBelizeBoliviaBosnia and HerzegovinaBrazilBulgariaBurma/MyanmarCabo VerdeCambodiaCameroonCanadaCaribbeanCentral AmericaChileChinaColombiaCongoCosta RicaCroatiaCubaCzechoslovakiaDenmarkDominicaDominican RepublicEastern AfricaEastern AsiaEastern EuropeEcuadorEgyptEl SalvadorEnglandEritreaEthiopiaEuropeFijiFranceGermanyGhanaGreeceGrenadaGuatemalaGuyanaHaitiHondurasHong KongHungaryIndiaIndonesiaIranIraqIrelandIsraelItalyJamaicaJapanJordanKazakhstanKenyaKoreaKuwaitLaosLatin AmericaLatviaLebanonLiberiaLithuaniaMalaysiaMexicoMicronesiaMiddle AfricaMoldovaMoroccoNepalNetherlandsNicaraguaNigeriaNorth AmericaNorth MacedoniaNorthern AfricaNorthern EuropeNorwayOceaniaPakistanPanamaPeruPhilippinesPolandPortugalRomaniaRussiaSaudi ArabiaScotlandSenegalSerbiaSierra LeoneSingaporeSomaliaSouth AfricaSouth AmericaSouth Central AsiaSouth Eastern AsiaSouthern EuropeSpainSri LankaSt. Vincent and the GrenadinesSudanSwedenSwitzerlandSyriaTaiwanThailandTrinidad and TobagoTurkeyUgandaUkraineUruguayUzbekistanVenezuelaVietnamWest IndiesWestern AfricaWestern AsiaWestern EuropeYemenZaireZimbabweAzores
Householder Income Over 65 years
Income
Poverty
Unemployment
Labor Participation
Family Structure
Vehicle Availability
Education Level
Disability

Householder Income Over 65 years Comparison

Alsatians

Finns

Good
Poor
$61,797
HOUSEHOLDER INCOME OVER 65 YEARS
70.5/ 100
METRIC RATING
148th/ 347
METRIC RANK
$59,535
HOUSEHOLDER INCOME OVER 65 YEARS
18.2/ 100
METRIC RATING
202nd/ 347
METRIC RANK

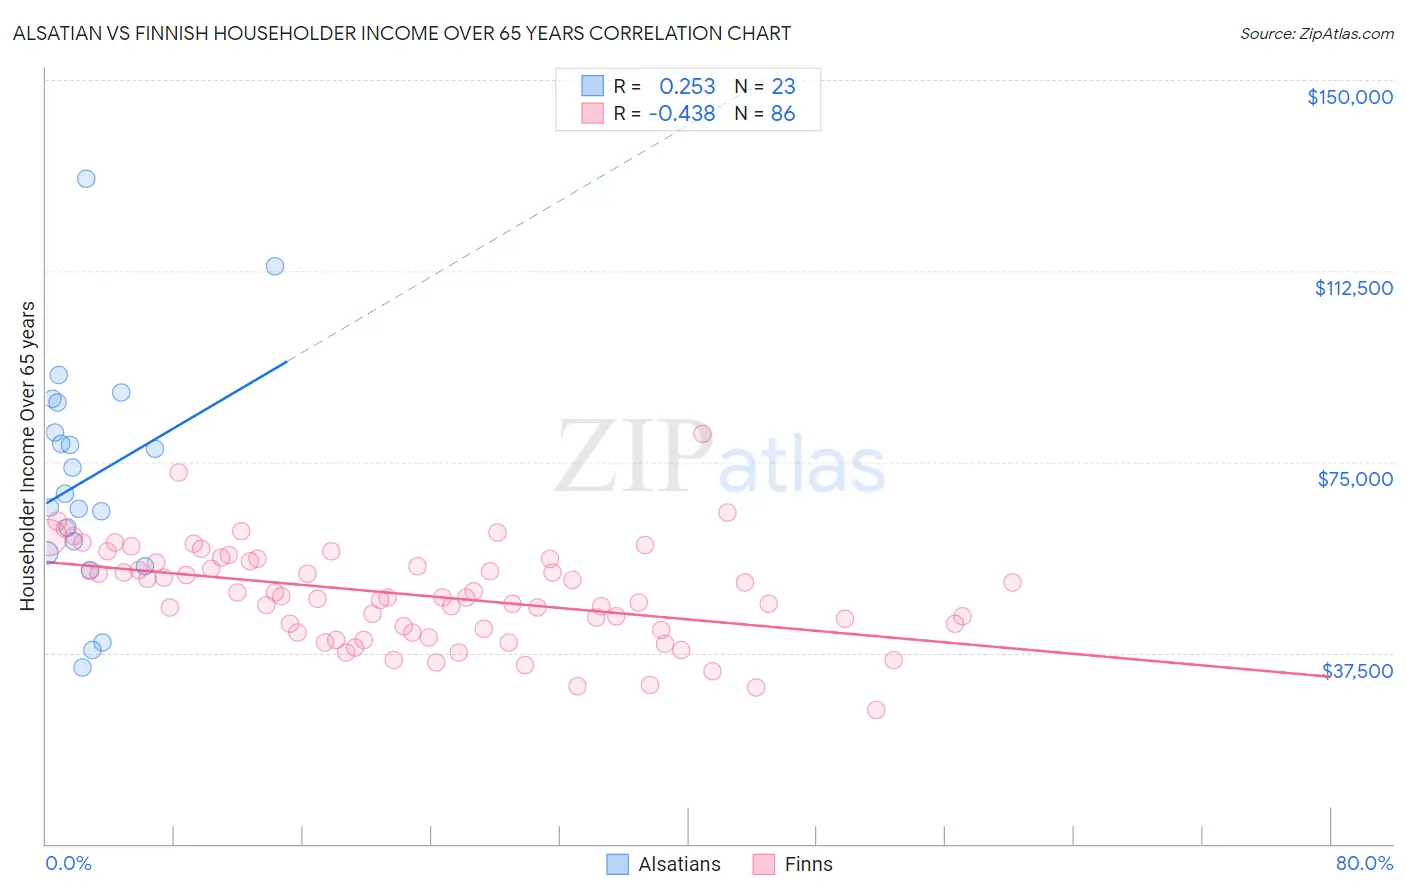
Alsatian vs Finnish Householder Income Over 65 years Correlation Chart

The statistical analysis conducted on geographies consisting of 82,660,993 people shows a weak positive correlation between the proportion of Alsatians and household income with householder over the age of 65 in the United States with a correlation coefficient (R) of 0.253 and weighted average of $61,797. Similarly, the statistical analysis conducted on geographies consisting of 403,493,749 people shows a moderate negative correlation between the proportion of Finns and household income with householder over the age of 65 in the United States with a correlation coefficient (R) of -0.438 and weighted average of $59,535, a difference of 3.8%.
Alsatian vs Finnish Householder Income Over 65 years

Householder Income Over 65 years Correlation Summary

MeasurementAlsatianFinnish
Minimum$34,700$26,250
Maximum$130,500$80,493
Range$95,800$54,243
Mean$71,864$48,855
Median$68,750$48,360
Interquartile 25% (IQ1)$57,175$41,947
Interquartile 75% (IQ3)$86,740$55,469
Interquartile Range (IQR)$29,565$13,523
Standard Deviation (Sample)$22,665$9,627
Standard Deviation (Population)$22,167$9,571

Similar Demographics by Householder Income Over 65 years

Demographics Similar to Alsatians by Householder Income Over 65 years

In terms of householder income over 65 years, the demographic groups most similar to Alsatians are Immigrants from Nepal ($61,843, a difference of 0.070%), Scottish ($61,735, a difference of 0.10%), Slavic ($61,709, a difference of 0.14%), Immigrants from Southern Europe ($61,902, a difference of 0.17%), and Hungarian ($61,673, a difference of 0.20%).
DemographicsRating | RankHouseholder Income Over 65 years
Canadians
79.0
/100
|
#141
Good
$62,230
South American Indians
78.7
/100
|
#142
Good
$62,215
Immigrants | Belarus
77.8
/100
|
#143
Good
$62,162
Immigrants | Peru
74.4
/100
|
#144
Good
$61,988
Immigrants | Uganda
74.2
/100
|
#145
Good
$61,976
Immigrants | Southern Europe
72.7
/100
|
#146
Good
$61,902
Immigrants | Nepal
71.4
/100
|
#147
Good
$61,843
Alsatians
70.5
/100
|
#148
Good
$61,797
Scottish
69.1
/100
|
#149
Good
$61,735
Slavs
68.5
/100
|
#150
Good
$61,709
Hungarians
67.7
/100
|
#151
Good
$61,673
Armenians
67.3
/100
|
#152
Good
$61,656
Costa Ricans
66.9
/100
|
#153
Good
$61,638
Swiss
66.5
/100
|
#154
Good
$61,621
Poles
65.9
/100
|
#155
Good
$61,598

Demographics Similar to Finns by Householder Income Over 65 years

In terms of householder income over 65 years, the demographic groups most similar to Finns are Dutch ($59,539, a difference of 0.010%), Scotch-Irish ($59,447, a difference of 0.15%), Immigrants ($59,656, a difference of 0.20%), French ($59,656, a difference of 0.20%), and Moroccan ($59,683, a difference of 0.25%).
DemographicsRating | RankHouseholder Income Over 65 years
Immigrants | Iraq
23.2
/100
|
#195
Fair
$59,824
Germans
21.5
/100
|
#196
Fair
$59,730
Immigrants | Kenya
21.1
/100
|
#197
Fair
$59,710
Moroccans
20.7
/100
|
#198
Fair
$59,683
Immigrants | Immigrants
20.2
/100
|
#199
Fair
$59,656
French
20.2
/100
|
#200
Fair
$59,656
Dutch
18.3
/100
|
#201
Poor
$59,539
Finns
18.2
/100
|
#202
Poor
$59,535
Scotch-Irish
16.9
/100
|
#203
Poor
$59,447
Arapaho
16.0
/100
|
#204
Poor
$59,383
Immigrants | Sudan
14.2
/100
|
#205
Poor
$59,248
Immigrants | South America
13.0
/100
|
#206
Poor
$59,151
Salvadorans
12.9
/100
|
#207
Poor
$59,141
Uruguayans
12.3
/100
|
#208
Poor
$59,090
Slovaks
11.7
/100
|
#209
Poor
$59,039