Aleut vs Immigrants from Brazil Median Male Earnings
COMPARE
Aleut
Immigrants from Brazil
Median Male Earnings
Median Male Earnings Comparison
Aleuts
Immigrants from Brazil
$51,168
MEDIAN MALE EARNINGS
3.7/ 100
METRIC RATING
233rd/ 347
METRIC RANK
$58,324
MEDIAN MALE EARNINGS
97.7/ 100
METRIC RATING
101st/ 347
METRIC RANK
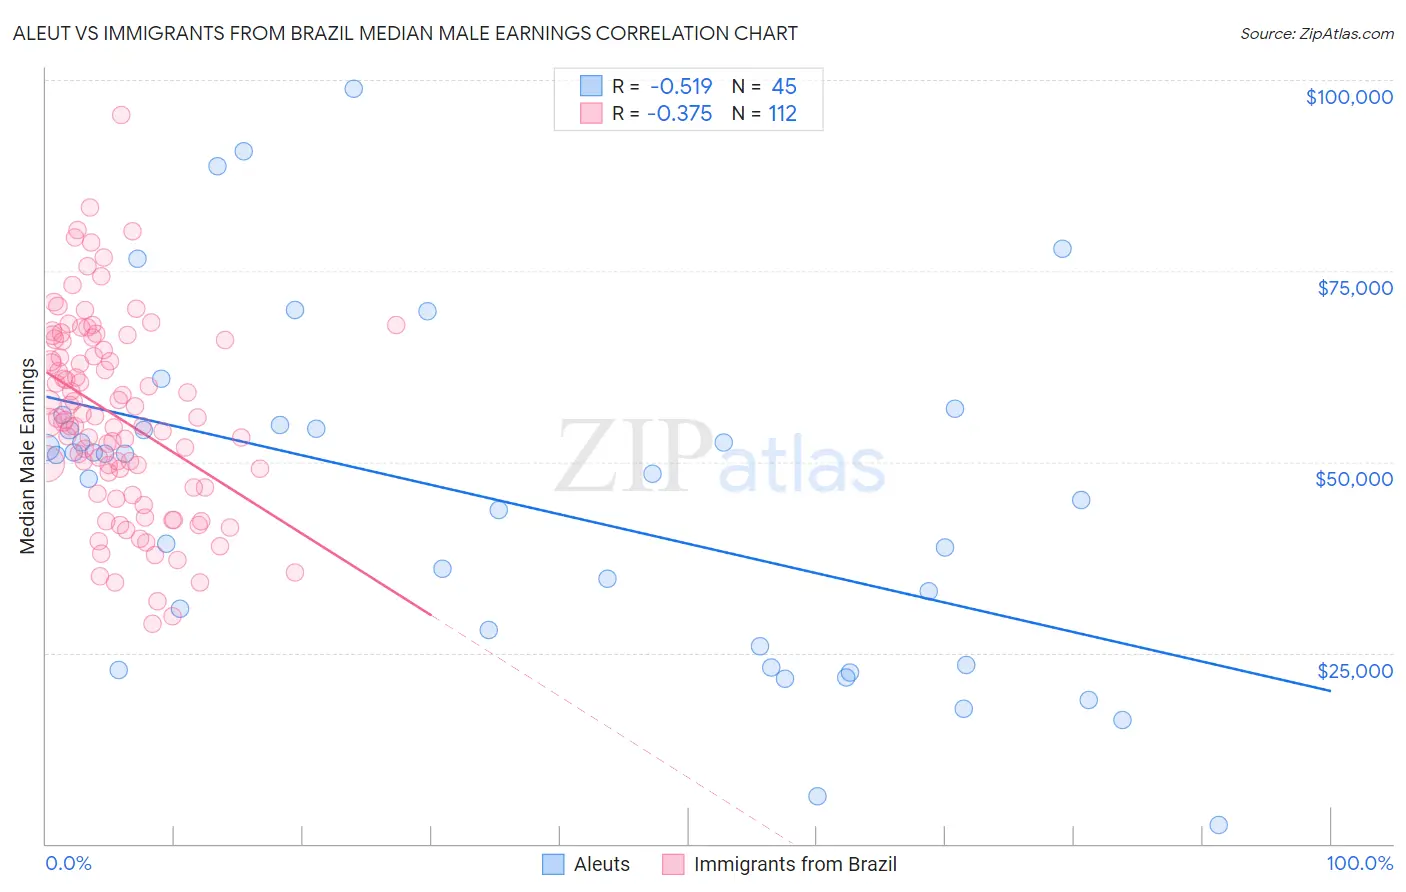
Aleut vs Immigrants from Brazil Median Male Earnings Correlation Chart
The statistical analysis conducted on geographies consisting of 61,765,699 people shows a substantial negative correlation between the proportion of Aleuts and median male earnings in the United States with a correlation coefficient (R) of -0.519 and weighted average of $51,168. Similarly, the statistical analysis conducted on geographies consisting of 342,925,188 people shows a mild negative correlation between the proportion of Immigrants from Brazil and median male earnings in the United States with a correlation coefficient (R) of -0.375 and weighted average of $58,324, a difference of 14.0%.
Median Male Earnings Correlation Summary
| Measurement | Aleut | Immigrants from Brazil |
| Minimum | $2,499 | $28,750 |
| Maximum | $98,906 | $95,391 |
| Range | $96,407 | $66,641 |
| Mean | $44,984 | $55,921 |
| Median | $48,500 | $55,594 |
| Interquartile 25% (IQ1) | $24,583 | $46,610 |
| Interquartile 75% (IQ3) | $54,582 | $65,884 |
| Interquartile Range (IQR) | $29,999 | $19,274 |
| Standard Deviation (Sample) | $22,008 | $12,788 |
| Standard Deviation (Population) | $21,762 | $12,730 |
Similar Demographics by Median Male Earnings
Demographics Similar to Aleuts by Median Male Earnings
In terms of median male earnings, the demographic groups most similar to Aleuts are Sudanese ($51,216, a difference of 0.090%), Barbadian ($51,236, a difference of 0.13%), Cape Verdean ($51,103, a difference of 0.13%), Immigrants from Nigeria ($51,310, a difference of 0.28%), and Immigrants from Trinidad and Tobago ($51,376, a difference of 0.41%).
| Demographics | Rating | Rank | Median Male Earnings |
| Japanese | 4.9 /100 | #226 | Tragic $51,473 |
| Trinidadians and Tobagonians | 4.8 /100 | #227 | Tragic $51,446 |
| Samoans | 4.6 /100 | #228 | Tragic $51,389 |
| Immigrants | Trinidad and Tobago | 4.5 /100 | #229 | Tragic $51,376 |
| Immigrants | Nigeria | 4.2 /100 | #230 | Tragic $51,310 |
| Barbadians | 3.9 /100 | #231 | Tragic $51,236 |
| Sudanese | 3.9 /100 | #232 | Tragic $51,216 |
| Aleuts | 3.7 /100 | #233 | Tragic $51,168 |
| Cape Verdeans | 3.5 /100 | #234 | Tragic $51,103 |
| Immigrants | Western Africa | 3.0 /100 | #235 | Tragic $50,940 |
| Pennsylvania Germans | 2.8 /100 | #236 | Tragic $50,878 |
| Immigrants | Barbados | 2.6 /100 | #237 | Tragic $50,795 |
| Malaysians | 2.5 /100 | #238 | Tragic $50,772 |
| Americans | 2.5 /100 | #239 | Tragic $50,761 |
| West Indians | 2.3 /100 | #240 | Tragic $50,682 |
Demographics Similar to Immigrants from Brazil by Median Male Earnings
In terms of median male earnings, the demographic groups most similar to Immigrants from Brazil are Assyrian/Chaldean/Syriac ($58,437, a difference of 0.19%), Immigrants from Poland ($58,452, a difference of 0.22%), Syrian ($58,187, a difference of 0.24%), Jordanian ($58,500, a difference of 0.30%), and Polish ($58,139, a difference of 0.32%).
| Demographics | Rating | Rank | Median Male Earnings |
| Immigrants | North Macedonia | 99.0 /100 | #94 | Exceptional $59,189 |
| Immigrants | Lebanon | 98.6 /100 | #95 | Exceptional $58,835 |
| Albanians | 98.4 /100 | #96 | Exceptional $58,680 |
| Northern Europeans | 98.2 /100 | #97 | Exceptional $58,588 |
| Jordanians | 98.1 /100 | #98 | Exceptional $58,500 |
| Immigrants | Poland | 98.0 /100 | #99 | Exceptional $58,452 |
| Assyrians/Chaldeans/Syriacs | 97.9 /100 | #100 | Exceptional $58,437 |
| Immigrants | Brazil | 97.7 /100 | #101 | Exceptional $58,324 |
| Syrians | 97.4 /100 | #102 | Exceptional $58,187 |
| Poles | 97.3 /100 | #103 | Exceptional $58,139 |
| Armenians | 97.3 /100 | #104 | Exceptional $58,134 |
| Immigrants | Western Asia | 97.3 /100 | #105 | Exceptional $58,131 |
| Immigrants | Northern Africa | 96.9 /100 | #106 | Exceptional $58,008 |
| Serbians | 96.8 /100 | #107 | Exceptional $57,975 |
| Immigrants | Uzbekistan | 96.7 /100 | #108 | Exceptional $57,941 |