Albanian vs Immigrants from Oceania Median Earnings

COMPARE

Albanian
Race
Ancestry
AfghanAfricanAlaska NativeAlaskan AthabascanAlbanianAleutAlsatianAmericanApacheArabArapahoArgentineanArmenianAssyrian/Chaldean/SyriacAustralianAustrianBahamianBangladeshiBarbadianBasqueBelgianBelizeanBermudanBhutaneseBlackfeetBolivianBrazilianBritishBritish West IndianBulgarianBurmeseCajunCambodianCanadianCape VerdeanCarpatho RusynCelticCentral AmericanCentral American IndianCherokeeCheyenneChickasawChileanChineseChippewaChoctawColombianColvilleComancheCosta RicanCreeCreekCroatianCrowCubanCypriotCzechCzechoslovakianDanishDelawareDominicanDutchDutch West IndianEastern EuropeanEcuadorianEgyptianEnglishEstonianEthiopianEuropeanFijianFilipinoFinnishFrenchFrench American IndianFrench CanadianGermanGerman RussianGhanaianGreekGuamanian/ChamorroGuatemalanGuyaneseHaitianHmongHonduranHopiHoumaHungarianIcelanderIndian (Asian)IndonesianInupiatIranianIraqiIrishIroquoisIsraeliItalianJamaicanJapaneseJordanianKenyanKiowaKoreanLaotianLatvianLebaneseLiberianLithuanianLumbeeLuxembourgerMacedonianMalaysianMalteseMarshalleseMenomineeMexicanMexican American IndianMongolianMoroccanNative HawaiianNavajoNepaleseNew ZealanderNicaraguanNigerianNorthern EuropeanNorwegianOkinawanOsageOttawaPaiutePakistaniPalestinianPanamanianParaguayanPennsylvania GermanPeruvianPimaPolishPortuguesePotawatomiPuebloPuerto RicanPuget Sound SalishRomanianRussianSalvadoranSamoanScandinavianScotch-IrishScottishSeminoleSenegaleseSerbianShoshoneSierra LeoneanSiouxSlavicSlovakSloveneSomaliSouth AfricanSouth AmericanSouth American IndianSoviet UnionSpaniardSpanishSpanish AmericanSpanish American IndianSri LankanSubsaharan AfricanSudaneseSwedishSwissSyrianTaiwaneseThaiTlingit-HaidaTohono O'OdhamTonganTrinidadian and TobagonianTsimshianTurkishU.S. Virgin IslanderUgandanUkrainianUruguayanUteVenezuelanVietnameseWelshWest IndianYakamaYaquiYugoslavianYumanYup'ikZimbabwean
Immigration
NonimmigrantsImmigrantsAfghanistanAfricaAlbaniaArgentinaArmeniaAsiaAustraliaAustriaBahamasBangladeshBarbadosBelarusBelgiumBelizeBoliviaBosnia and HerzegovinaBrazilBulgariaBurma/MyanmarCabo VerdeCambodiaCameroonCanadaCaribbeanCentral AmericaChileChinaColombiaCongoCosta RicaCroatiaCubaCzechoslovakiaDenmarkDominicaDominican RepublicEastern AfricaEastern AsiaEastern EuropeEcuadorEgyptEl SalvadorEnglandEritreaEthiopiaEuropeFijiFranceGermanyGhanaGreeceGrenadaGuatemalaGuyanaHaitiHondurasHong KongHungaryIndiaIndonesiaIranIraqIrelandIsraelItalyJamaicaJapanJordanKazakhstanKenyaKoreaKuwaitLaosLatin AmericaLatviaLebanonLiberiaLithuaniaMalaysiaMexicoMicronesiaMiddle AfricaMoldovaMoroccoNepalNetherlandsNicaraguaNigeriaNorth AmericaNorth MacedoniaNorthern AfricaNorthern EuropeNorwayPakistanPanamaPeruPhilippinesPolandPortugalRomaniaRussiaSaudi ArabiaScotlandSenegalSerbiaSierra LeoneSingaporeSomaliaSouth AfricaSouth AmericaSouth Central AsiaSouth Eastern AsiaSouthern EuropeSpainSri LankaSt. Vincent and the GrenadinesSudanSwedenSwitzerlandSyriaTaiwanThailandTrinidad and TobagoTurkeyUgandaUkraineUruguayUzbekistanVenezuelaVietnamWest IndiesWestern AfricaWestern AsiaWestern EuropeYemenZaireZimbabweAzores
Immigrants from Oceania
Race
Ancestry
AfghanAfricanAlaska NativeAlaskan AthabascanAleutAlsatianAmericanApacheArabArapahoArgentineanArmenianAssyrian/Chaldean/SyriacAustralianAustrianBahamianBangladeshiBarbadianBasqueBelgianBelizeanBermudanBhutaneseBlackfeetBolivianBrazilianBritishBritish West IndianBulgarianBurmeseCajunCambodianCanadianCape VerdeanCarpatho RusynCelticCentral AmericanCentral American IndianCherokeeCheyenneChickasawChileanChineseChippewaChoctawColombianColvilleComancheCosta RicanCreeCreekCroatianCrowCubanCypriotCzechCzechoslovakianDanishDelawareDominicanDutchDutch West IndianEastern EuropeanEcuadorianEgyptianEnglishEstonianEthiopianEuropeanFijianFilipinoFinnishFrenchFrench American IndianFrench CanadianGermanGerman RussianGhanaianGreekGuamanian/ChamorroGuatemalanGuyaneseHaitianHmongHonduranHopiHoumaHungarianIcelanderIndian (Asian)IndonesianInupiatIranianIraqiIrishIroquoisIsraeliItalianJamaicanJapaneseJordanianKenyanKiowaKoreanLaotianLatvianLebaneseLiberianLithuanianLumbeeLuxembourgerMacedonianMalaysianMalteseMarshalleseMenomineeMexicanMexican American IndianMongolianMoroccanNative HawaiianNavajoNepaleseNew ZealanderNicaraguanNigerianNorthern EuropeanNorwegianOkinawanOsageOttawaPaiutePakistaniPalestinianPanamanianParaguayanPennsylvania GermanPeruvianPimaPolishPortuguesePotawatomiPuebloPuerto RicanPuget Sound SalishRomanianRussianSalvadoranSamoanScandinavianScotch-IrishScottishSeminoleSenegaleseSerbianShoshoneSierra LeoneanSiouxSlavicSlovakSloveneSomaliSouth AfricanSouth AmericanSouth American IndianSoviet UnionSpaniardSpanishSpanish AmericanSpanish American IndianSri LankanSubsaharan AfricanSudaneseSwedishSwissSyrianTaiwaneseThaiTlingit-HaidaTohono O'OdhamTonganTrinidadian and TobagonianTsimshianTurkishU.S. Virgin IslanderUgandanUkrainianUruguayanUteVenezuelanVietnameseWelshWest IndianYakamaYaquiYugoslavianYumanYup'ikZimbabwean
Immigration
NonimmigrantsImmigrantsAfghanistanAfricaAlbaniaArgentinaArmeniaAsiaAustraliaAustriaBahamasBangladeshBarbadosBelarusBelgiumBelizeBoliviaBosnia and HerzegovinaBrazilBulgariaBurma/MyanmarCabo VerdeCambodiaCameroonCanadaCaribbeanCentral AmericaChileChinaColombiaCongoCosta RicaCroatiaCubaCzechoslovakiaDenmarkDominicaDominican RepublicEastern AfricaEastern AsiaEastern EuropeEcuadorEgyptEl SalvadorEnglandEritreaEthiopiaEuropeFijiFranceGermanyGhanaGreeceGrenadaGuatemalaGuyanaHaitiHondurasHong KongHungaryIndiaIndonesiaIranIraqIrelandIsraelItalyJamaicaJapanJordanKazakhstanKenyaKoreaKuwaitLaosLatin AmericaLatviaLebanonLiberiaLithuaniaMalaysiaMexicoMicronesiaMiddle AfricaMoldovaMoroccoNepalNetherlandsNicaraguaNigeriaNorth AmericaNorth MacedoniaNorthern AfricaNorthern EuropeNorwayOceaniaPakistanPanamaPeruPhilippinesPolandPortugalRomaniaRussiaSaudi ArabiaScotlandSenegalSerbiaSierra LeoneSingaporeSomaliaSouth AfricaSouth AmericaSouth Central AsiaSouth Eastern AsiaSouthern EuropeSpainSri LankaSt. Vincent and the GrenadinesSudanSwedenSwitzerlandSyriaTaiwanThailandTrinidad and TobagoTurkeyUgandaUkraineUruguayUzbekistanVenezuelaVietnamWest IndiesWestern AfricaWestern AsiaWestern EuropeYemenZaireZimbabweAzores
Median Earnings
Income
Poverty
Unemployment
Labor Participation
Family Structure
Vehicle Availability
Education Level
Disability

Median Earnings Comparison

Albanians

Immigrants from Oceania

Exceptional
Excellent
$50,116
MEDIAN EARNINGS
99.4/ 100
METRIC RATING
88th/ 347
METRIC RANK
$47,617
MEDIAN EARNINGS
84.1/ 100
METRIC RATING
151st/ 347
METRIC RANK

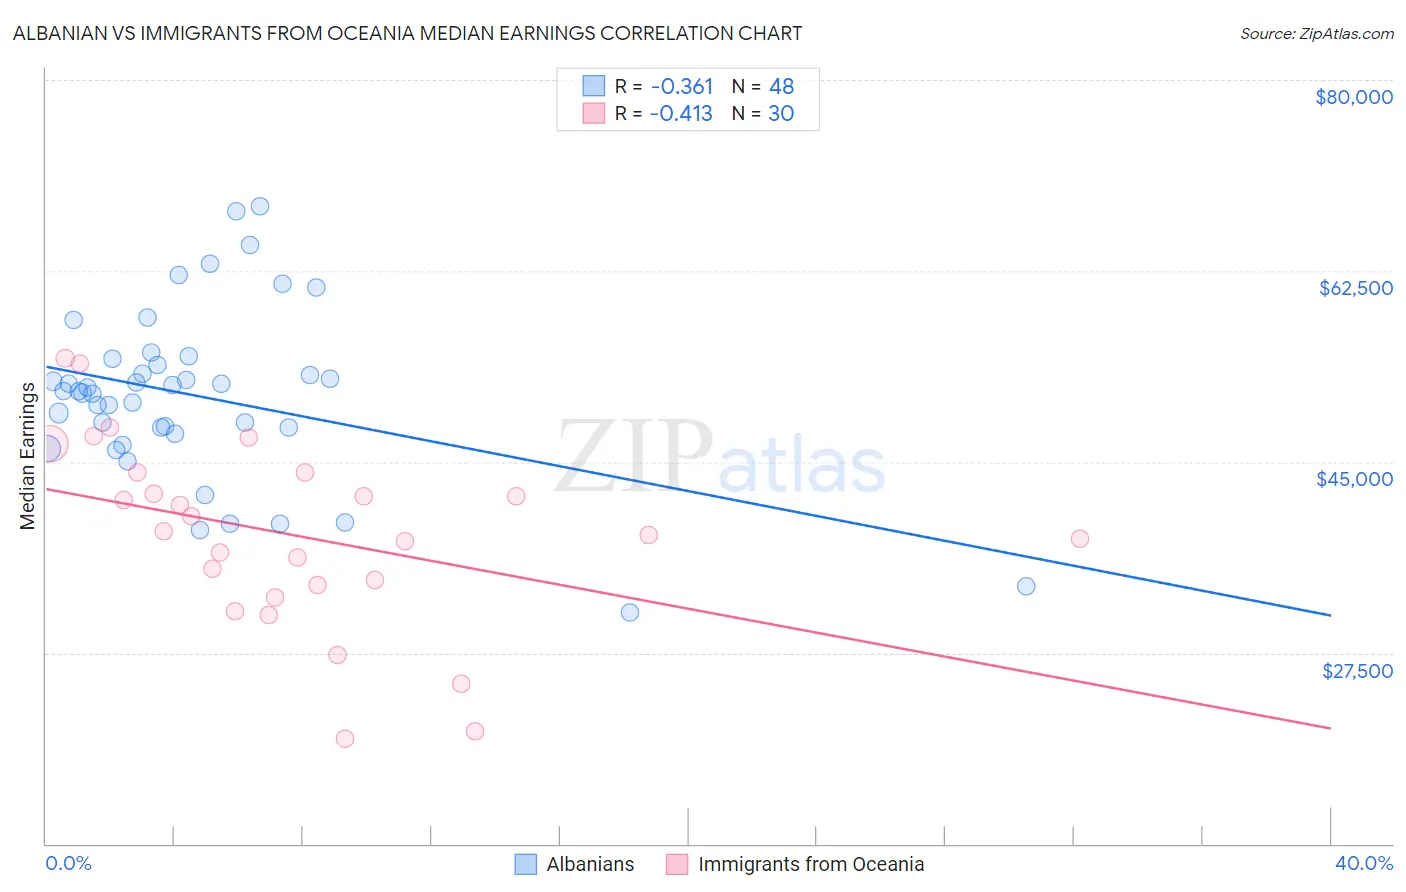
Albanian vs Immigrants from Oceania Median Earnings Correlation Chart

The statistical analysis conducted on geographies consisting of 193,255,601 people shows a mild negative correlation between the proportion of Albanians and median earnings in the United States with a correlation coefficient (R) of -0.361 and weighted average of $50,116. Similarly, the statistical analysis conducted on geographies consisting of 305,514,828 people shows a moderate negative correlation between the proportion of Immigrants from Oceania and median earnings in the United States with a correlation coefficient (R) of -0.413 and weighted average of $47,617, a difference of 5.2%.
Albanian vs Immigrants from Oceania Median Earnings

Median Earnings Correlation Summary

MeasurementAlbanianImmigrants from Oceania
Minimum$31,250$19,583
Maximum$68,474$54,486
Range$37,224$34,903
Mean$51,050$38,323
Median$51,491$38,462
Interquartile 25% (IQ1)$47,850$33,709
Interquartile 75% (IQ3)$54,177$44,026
Interquartile Range (IQR)$6,327$10,317
Standard Deviation (Sample)$7,882$8,581
Standard Deviation (Population)$7,799$8,437

Similar Demographics by Median Earnings

Demographics Similar to Albanians by Median Earnings

In terms of median earnings, the demographic groups most similar to Albanians are Immigrants from North America ($50,108, a difference of 0.020%), Immigrants from Uzbekistan ($50,151, a difference of 0.070%), Immigrants from Canada ($50,192, a difference of 0.15%), Immigrants from Hungary ($50,227, a difference of 0.22%), and Immigrants from Kazakhstan ($50,225, a difference of 0.22%).
DemographicsRating | RankMedian Earnings
Immigrants | Southern Europe
99.6
/100
|
#81
Exceptional
$50,280
Immigrants | Moldova
99.5
/100
|
#82
Exceptional
$50,274
Romanians
99.5
/100
|
#83
Exceptional
$50,244
Immigrants | Hungary
99.5
/100
|
#84
Exceptional
$50,227
Immigrants | Kazakhstan
99.5
/100
|
#85
Exceptional
$50,225
Immigrants | Canada
99.5
/100
|
#86
Exceptional
$50,192
Immigrants | Uzbekistan
99.5
/100
|
#87
Exceptional
$50,151
Albanians
99.4
/100
|
#88
Exceptional
$50,116
Immigrants | North America
99.4
/100
|
#89
Exceptional
$50,108
Italians
99.3
/100
|
#90
Exceptional
$49,915
Macedonians
99.2
/100
|
#91
Exceptional
$49,893
Immigrants | Argentina
99.2
/100
|
#92
Exceptional
$49,841
Armenians
99.1
/100
|
#93
Exceptional
$49,804
Croatians
99.0
/100
|
#94
Exceptional
$49,724
Immigrants | England
99.0
/100
|
#95
Exceptional
$49,722

Demographics Similar to Immigrants from Oceania by Median Earnings

In terms of median earnings, the demographic groups most similar to Immigrants from Oceania are Peruvian ($47,628, a difference of 0.020%), Luxembourger ($47,640, a difference of 0.050%), Immigrants from Eritrea ($47,657, a difference of 0.080%), Immigrants from South Eastern Asia ($47,671, a difference of 0.11%), and Immigrants from Germany ($47,566, a difference of 0.11%).
DemographicsRating | RankMedian Earnings
Hungarians
87.1
/100
|
#144
Excellent
$47,795
Immigrants | Saudi Arabia
85.6
/100
|
#145
Excellent
$47,704
Immigrants | Chile
85.5
/100
|
#146
Excellent
$47,697
Immigrants | South Eastern Asia
85.0
/100
|
#147
Excellent
$47,671
Immigrants | Eritrea
84.8
/100
|
#148
Excellent
$47,657
Luxembourgers
84.5
/100
|
#149
Excellent
$47,640
Peruvians
84.2
/100
|
#150
Excellent
$47,628
Immigrants | Oceania
84.1
/100
|
#151
Excellent
$47,617
Immigrants | Germany
83.1
/100
|
#152
Excellent
$47,566
Slavs
81.1
/100
|
#153
Excellent
$47,470
Immigrants | Portugal
77.3
/100
|
#154
Good
$47,304
Immigrants | Vietnam
76.7
/100
|
#155
Good
$47,282
Irish
76.6
/100
|
#156
Good
$47,276
Czechs
75.1
/100
|
#157
Good
$47,221
Slovaks
71.7
/100
|
#158
Good
$47,095