Alaska Native vs Immigrants from Western Asia Householder Income Under 25 years
COMPARE
Alaska Native
Immigrants from Western Asia
Householder Income Under 25 years
Householder Income Under 25 years Comparison
Alaska Natives
Immigrants from Western Asia
$54,000
HOUSEHOLDER INCOME UNDER 25 YEARS
98.8/ 100
METRIC RATING
99th/ 347
METRIC RANK
$52,190
HOUSEHOLDER INCOME UNDER 25 YEARS
50.0/ 100
METRIC RATING
174th/ 347
METRIC RANK
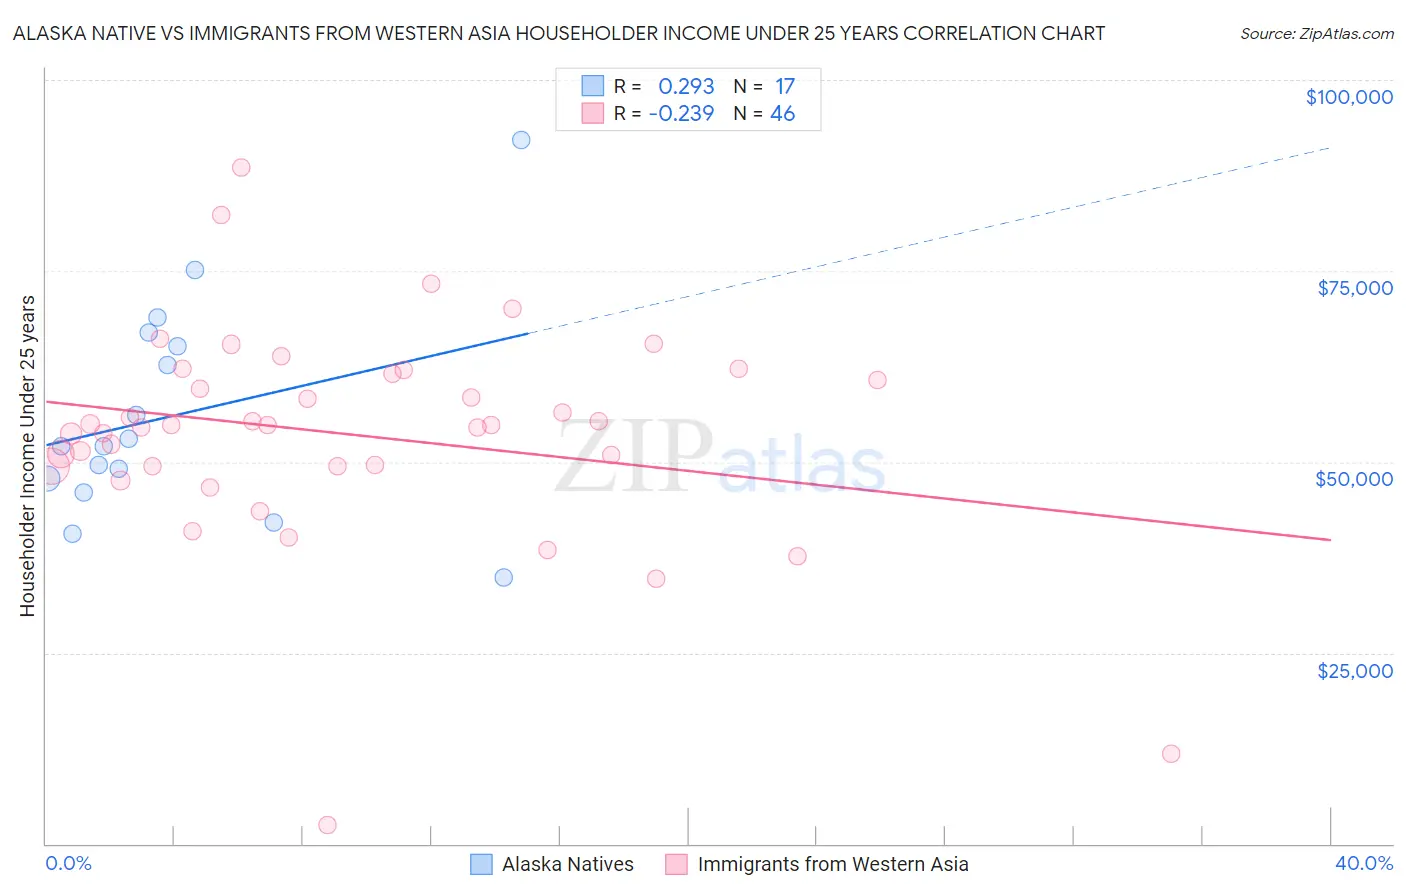
Alaska Native vs Immigrants from Western Asia Householder Income Under 25 years Correlation Chart
The statistical analysis conducted on geographies consisting of 73,501,292 people shows a weak positive correlation between the proportion of Alaska Natives and household income with householder under the age of 25 in the United States with a correlation coefficient (R) of 0.293 and weighted average of $54,000. Similarly, the statistical analysis conducted on geographies consisting of 339,196,306 people shows a weak negative correlation between the proportion of Immigrants from Western Asia and household income with householder under the age of 25 in the United States with a correlation coefficient (R) of -0.239 and weighted average of $52,190, a difference of 3.5%.
Householder Income Under 25 years Correlation Summary
| Measurement | Alaska Native | Immigrants from Western Asia |
| Minimum | $34,792 | $2,499 |
| Maximum | $92,109 | $88,535 |
| Range | $57,317 | $86,036 |
| Mean | $56,134 | $53,619 |
| Median | $52,108 | $54,787 |
| Interquartile 25% (IQ1) | $46,888 | $49,428 |
| Interquartile 75% (IQ3) | $66,052 | $61,469 |
| Interquartile Range (IQR) | $19,164 | $12,041 |
| Standard Deviation (Sample) | $14,277 | $14,523 |
| Standard Deviation (Population) | $13,850 | $14,365 |
Similar Demographics by Householder Income Under 25 years
Demographics Similar to Alaska Natives by Householder Income Under 25 years
In terms of householder income under 25 years, the demographic groups most similar to Alaska Natives are Immigrants from Kazakhstan ($53,990, a difference of 0.020%), South American ($53,939, a difference of 0.11%), Eastern European ($54,066, a difference of 0.12%), Ecuadorian ($53,911, a difference of 0.16%), and Immigrants from Portugal ($54,105, a difference of 0.19%).
| Demographics | Rating | Rank | Householder Income Under 25 years |
| Immigrants | St. Vincent and the Grenadines | 99.3 /100 | #92 | Exceptional $54,230 |
| Immigrants | Argentina | 99.3 /100 | #93 | Exceptional $54,209 |
| Immigrants | Sierra Leone | 99.3 /100 | #94 | Exceptional $54,190 |
| Immigrants | Malaysia | 99.2 /100 | #95 | Exceptional $54,179 |
| Argentineans | 99.2 /100 | #96 | Exceptional $54,154 |
| Immigrants | Portugal | 99.1 /100 | #97 | Exceptional $54,105 |
| Eastern Europeans | 99.0 /100 | #98 | Exceptional $54,066 |
| Alaska Natives | 98.8 /100 | #99 | Exceptional $54,000 |
| Immigrants | Kazakhstan | 98.8 /100 | #100 | Exceptional $53,990 |
| South Americans | 98.6 /100 | #101 | Exceptional $53,939 |
| Ecuadorians | 98.5 /100 | #102 | Exceptional $53,911 |
| Ukrainians | 98.3 /100 | #103 | Exceptional $53,843 |
| Ethiopians | 98.2 /100 | #104 | Exceptional $53,818 |
| Immigrants | France | 98.1 /100 | #105 | Exceptional $53,805 |
| Albanians | 98.1 /100 | #106 | Exceptional $53,794 |
Demographics Similar to Immigrants from Western Asia by Householder Income Under 25 years
In terms of householder income under 25 years, the demographic groups most similar to Immigrants from Western Asia are Barbadian ($52,202, a difference of 0.020%), Cypriot ($52,209, a difference of 0.040%), Immigrants from Uruguay ($52,302, a difference of 0.21%), Canadian ($52,336, a difference of 0.28%), and Israeli ($52,335, a difference of 0.28%).
| Demographics | Rating | Rank | Householder Income Under 25 years |
| Immigrants | Uganda | 61.1 /100 | #167 | Good $52,374 |
| Japanese | 60.5 /100 | #168 | Good $52,365 |
| Canadians | 58.8 /100 | #169 | Average $52,336 |
| Israelis | 58.8 /100 | #170 | Average $52,335 |
| Immigrants | Uruguay | 56.8 /100 | #171 | Average $52,302 |
| Cypriots | 51.2 /100 | #172 | Average $52,209 |
| Barbadians | 50.8 /100 | #173 | Average $52,202 |
| Immigrants | Western Asia | 50.0 /100 | #174 | Average $52,190 |
| Immigrants | Zimbabwe | 33.8 /100 | #175 | Fair $51,914 |
| Austrians | 32.9 /100 | #176 | Fair $51,898 |
| British West Indians | 30.0 /100 | #177 | Fair $51,844 |
| Finns | 29.2 /100 | #178 | Fair $51,827 |
| Basques | 28.7 /100 | #179 | Fair $51,818 |
| Immigrants | England | 28.7 /100 | #180 | Fair $51,817 |
| Europeans | 27.6 /100 | #181 | Fair $51,796 |