Alaska Native vs Immigrants from Belgium Householder Income Ages 25 - 44 years
COMPARE
Alaska Native
Immigrants from Belgium
Householder Income Ages 25 - 44 years
Householder Income Ages 25 - 44 years Comparison
Alaska Natives
Immigrants from Belgium
$88,018
HOUSEHOLDER INCOME AGES 25 - 44 YEARS
2.6/ 100
METRIC RATING
238th/ 347
METRIC RANK
$112,575
HOUSEHOLDER INCOME AGES 25 - 44 YEARS
100.0/ 100
METRIC RATING
22nd/ 347
METRIC RANK
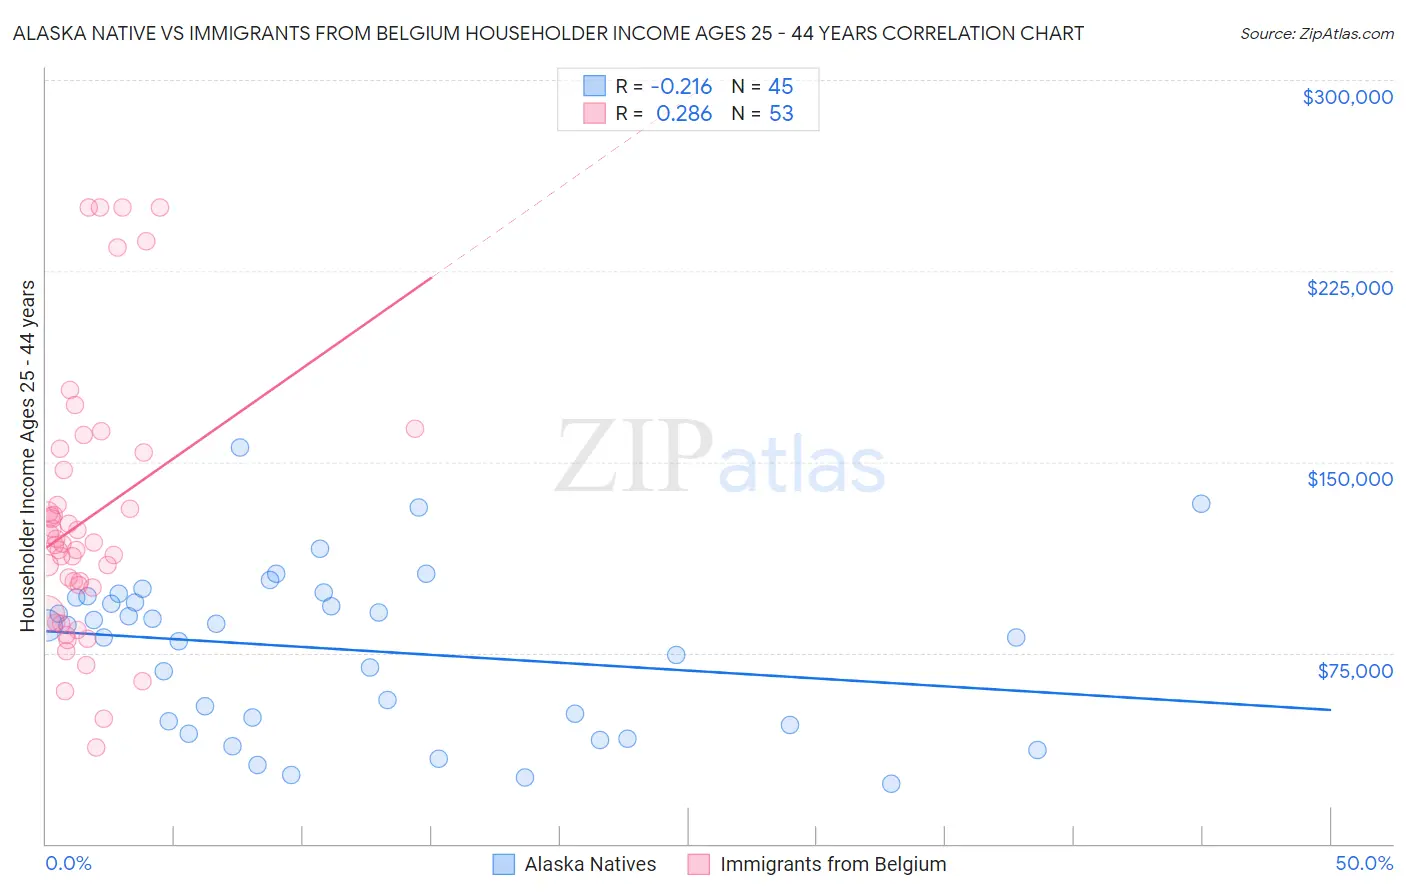
Alaska Native vs Immigrants from Belgium Householder Income Ages 25 - 44 years Correlation Chart
The statistical analysis conducted on geographies consisting of 76,687,896 people shows a weak negative correlation between the proportion of Alaska Natives and household income with householder between the ages 25 and 44 in the United States with a correlation coefficient (R) of -0.216 and weighted average of $88,018. Similarly, the statistical analysis conducted on geographies consisting of 146,567,695 people shows a weak positive correlation between the proportion of Immigrants from Belgium and household income with householder between the ages 25 and 44 in the United States with a correlation coefficient (R) of 0.286 and weighted average of $112,575, a difference of 27.9%.
Householder Income Ages 25 - 44 years Correlation Summary
| Measurement | Alaska Native | Immigrants from Belgium |
| Minimum | $23,750 | $37,722 |
| Maximum | $155,658 | $250,001 |
| Range | $131,908 | $212,279 |
| Mean | $76,232 | $127,529 |
| Median | $85,753 | $118,034 |
| Interquartile 25% (IQ1) | $47,396 | $95,583 |
| Interquartile 75% (IQ3) | $96,980 | $150,293 |
| Interquartile Range (IQR) | $49,584 | $54,710 |
| Standard Deviation (Sample) | $31,478 | $51,958 |
| Standard Deviation (Population) | $31,126 | $51,466 |
Similar Demographics by Householder Income Ages 25 - 44 years
Demographics Similar to Alaska Natives by Householder Income Ages 25 - 44 years
In terms of householder income ages 25 - 44 years, the demographic groups most similar to Alaska Natives are Salvadoran ($88,198, a difference of 0.20%), Immigrants from Cameroon ($88,214, a difference of 0.22%), Venezuelan ($88,232, a difference of 0.24%), Bermudan ($88,231, a difference of 0.24%), and Immigrants from Ghana ($87,760, a difference of 0.29%).
| Demographics | Rating | Rank | Householder Income Ages 25 - 44 years |
| Immigrants | Grenada | 3.0 /100 | #231 | Tragic $88,311 |
| Immigrants | Nonimmigrants | 3.0 /100 | #232 | Tragic $88,301 |
| Malaysians | 3.0 /100 | #233 | Tragic $88,291 |
| Venezuelans | 2.9 /100 | #234 | Tragic $88,232 |
| Bermudans | 2.9 /100 | #235 | Tragic $88,231 |
| Immigrants | Cameroon | 2.9 /100 | #236 | Tragic $88,214 |
| Salvadorans | 2.8 /100 | #237 | Tragic $88,198 |
| Alaska Natives | 2.6 /100 | #238 | Tragic $88,018 |
| Immigrants | Ghana | 2.2 /100 | #239 | Tragic $87,760 |
| Nicaraguans | 2.2 /100 | #240 | Tragic $87,751 |
| Nigerians | 2.2 /100 | #241 | Tragic $87,730 |
| West Indians | 1.7 /100 | #242 | Tragic $87,205 |
| Immigrants | West Indies | 1.5 /100 | #243 | Tragic $87,063 |
| Immigrants | Venezuela | 1.5 /100 | #244 | Tragic $87,038 |
| Immigrants | El Salvador | 1.4 /100 | #245 | Tragic $86,913 |
Demographics Similar to Immigrants from Belgium by Householder Income Ages 25 - 44 years
In terms of householder income ages 25 - 44 years, the demographic groups most similar to Immigrants from Belgium are Asian ($112,666, a difference of 0.080%), Immigrants from Japan ($112,228, a difference of 0.31%), Immigrants from Sweden ($112,010, a difference of 0.50%), Immigrants from Korea ($113,401, a difference of 0.73%), and Immigrants from Northern Europe ($111,676, a difference of 0.80%).
| Demographics | Rating | Rank | Householder Income Ages 25 - 44 years |
| Immigrants | South Central Asia | 100.0 /100 | #15 | Exceptional $116,626 |
| Cypriots | 100.0 /100 | #16 | Exceptional $116,364 |
| Immigrants | Australia | 100.0 /100 | #17 | Exceptional $115,947 |
| Eastern Europeans | 100.0 /100 | #18 | Exceptional $114,523 |
| Burmese | 100.0 /100 | #19 | Exceptional $113,701 |
| Immigrants | Korea | 100.0 /100 | #20 | Exceptional $113,401 |
| Asians | 100.0 /100 | #21 | Exceptional $112,666 |
| Immigrants | Belgium | 100.0 /100 | #22 | Exceptional $112,575 |
| Immigrants | Japan | 100.0 /100 | #23 | Exceptional $112,228 |
| Immigrants | Sweden | 100.0 /100 | #24 | Exceptional $112,010 |
| Immigrants | Northern Europe | 100.0 /100 | #25 | Exceptional $111,676 |
| Immigrants | Asia | 100.0 /100 | #26 | Exceptional $110,787 |
| Russians | 100.0 /100 | #27 | Exceptional $110,398 |
| Immigrants | Denmark | 100.0 /100 | #28 | Exceptional $110,363 |
| Turks | 100.0 /100 | #29 | Exceptional $110,318 |