Afghan vs Immigrants from South Africa Median Earnings
COMPARE
Afghan
Immigrants from South Africa
Median Earnings
Median Earnings Comparison
Afghans
Immigrants from South Africa
$51,112
MEDIAN EARNINGS
99.9/ 100
METRIC RATING
66th/ 347
METRIC RANK
$51,850
MEDIAN EARNINGS
100.0/ 100
METRIC RATING
50th/ 347
METRIC RANK
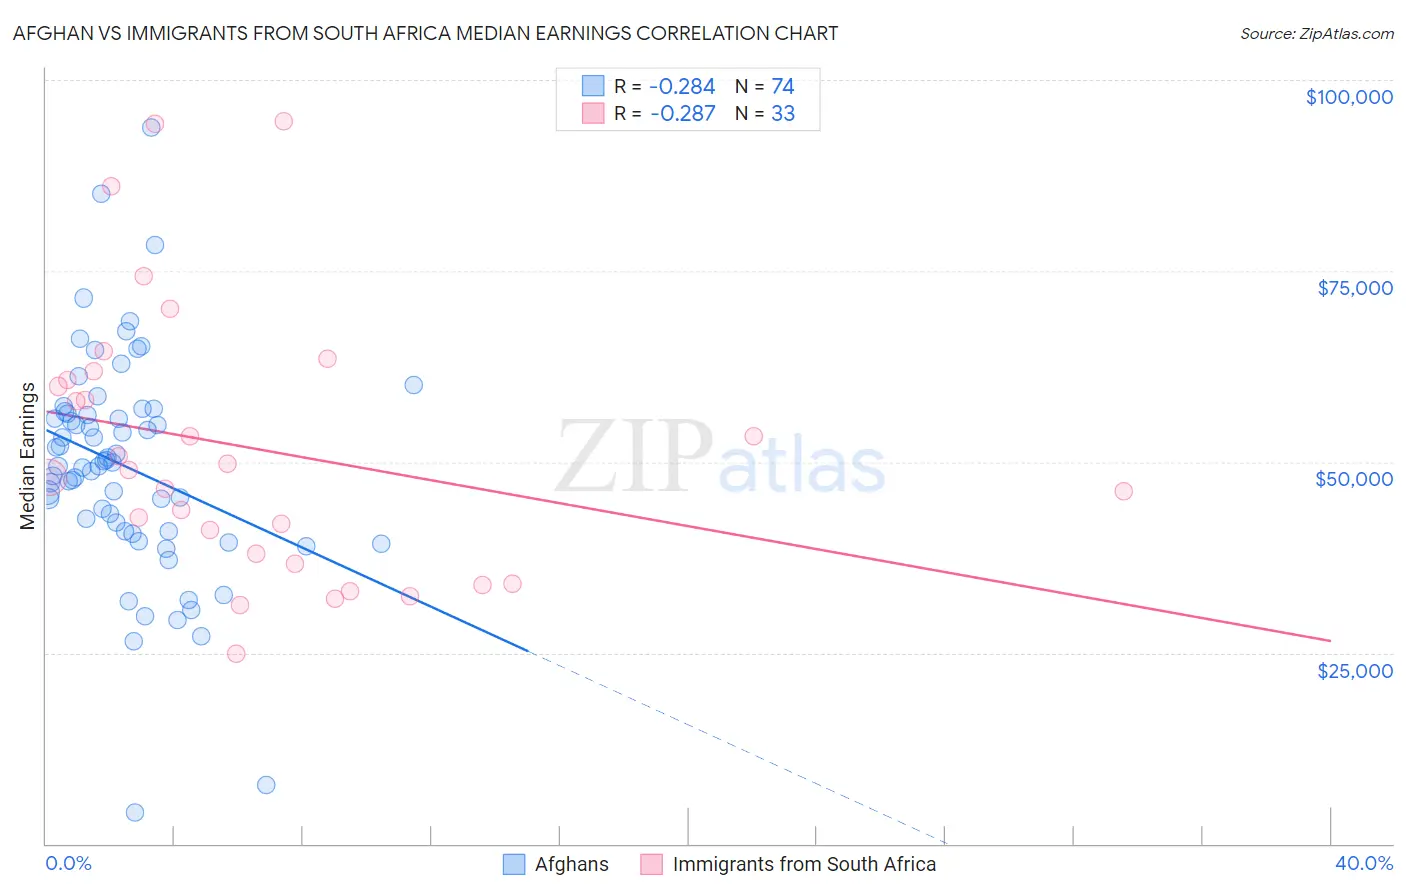
Afghan vs Immigrants from South Africa Median Earnings Correlation Chart
The statistical analysis conducted on geographies consisting of 148,874,377 people shows a weak negative correlation between the proportion of Afghans and median earnings in the United States with a correlation coefficient (R) of -0.284 and weighted average of $51,112. Similarly, the statistical analysis conducted on geographies consisting of 233,296,995 people shows a weak negative correlation between the proportion of Immigrants from South Africa and median earnings in the United States with a correlation coefficient (R) of -0.287 and weighted average of $51,850, a difference of 1.4%.
Median Earnings Correlation Summary
| Measurement | Afghan | Immigrants from South Africa |
| Minimum | $4,034 | $24,853 |
| Maximum | $93,750 | $94,663 |
| Range | $89,716 | $69,810 |
| Mean | $49,335 | $51,765 |
| Median | $49,670 | $48,953 |
| Interquartile 25% (IQ1) | $40,877 | $37,328 |
| Interquartile 75% (IQ3) | $56,283 | $61,361 |
| Interquartile Range (IQR) | $15,406 | $24,033 |
| Standard Deviation (Sample) | $14,513 | $17,731 |
| Standard Deviation (Population) | $14,415 | $17,460 |
Demographics Similar to Afghans and Immigrants from South Africa by Median Earnings
In terms of median earnings, the demographic groups most similar to Afghans are Immigrants from Spain ($51,092, a difference of 0.040%), Paraguayan ($51,068, a difference of 0.090%), Greek ($51,164, a difference of 0.10%), New Zealander ($51,246, a difference of 0.26%), and Immigrants from Bulgaria ($51,318, a difference of 0.40%). Similarly, the demographic groups most similar to Immigrants from South Africa are Immigrants from Austria ($51,826, a difference of 0.050%), Estonian ($51,772, a difference of 0.15%), Immigrants from Norway ($51,758, a difference of 0.18%), Immigrants from Indonesia ($51,715, a difference of 0.26%), and Egyptian ($51,701, a difference of 0.29%).
| Demographics | Rating | Rank | Median Earnings |
| Immigrants | Europe | 100.0 /100 | #48 | Exceptional $52,195 |
| Bolivians | 100.0 /100 | #49 | Exceptional $52,005 |
| Immigrants | South Africa | 100.0 /100 | #50 | Exceptional $51,850 |
| Immigrants | Austria | 99.9 /100 | #51 | Exceptional $51,826 |
| Estonians | 99.9 /100 | #52 | Exceptional $51,772 |
| Immigrants | Norway | 99.9 /100 | #53 | Exceptional $51,758 |
| Immigrants | Indonesia | 99.9 /100 | #54 | Exceptional $51,715 |
| Egyptians | 99.9 /100 | #55 | Exceptional $51,701 |
| Immigrants | Pakistan | 99.9 /100 | #56 | Exceptional $51,693 |
| Immigrants | Eastern Europe | 99.9 /100 | #57 | Exceptional $51,624 |
| Immigrants | Bolivia | 99.9 /100 | #58 | Exceptional $51,605 |
| Immigrants | Croatia | 99.9 /100 | #59 | Exceptional $51,581 |
| Immigrants | Serbia | 99.9 /100 | #60 | Exceptional $51,557 |
| Immigrants | Latvia | 99.9 /100 | #61 | Exceptional $51,555 |
| Immigrants | Romania | 99.9 /100 | #62 | Exceptional $51,337 |
| Immigrants | Bulgaria | 99.9 /100 | #63 | Exceptional $51,318 |
| New Zealanders | 99.9 /100 | #64 | Exceptional $51,246 |
| Greeks | 99.9 /100 | #65 | Exceptional $51,164 |
| Afghans | 99.9 /100 | #66 | Exceptional $51,112 |
| Immigrants | Spain | 99.9 /100 | #67 | Exceptional $51,092 |
| Paraguayans | 99.9 /100 | #68 | Exceptional $51,068 |