Heeia, HI
Heeia Map
Heeia Overview
4,786
TOTAL POPULATION
2,347
MALE POPULATION
2,439
FEMALE POPULATION
96.23
MALES / 100 FEMALES
103.92
FEMALES / 100 MALES
51.4
MEDIAN AGE
3.3
AVG FAMILY SIZE
3.0
AVG HOUSEHOLD SIZE
$64,918
PER CAPITA INCOME
$165,833
AVG FAMILY INCOME
$143,214
AVG HOUSEHOLD INCOME
28.3%
WAGE / INCOME GAP [ % ]
71.7¢/ $1
WAGE / INCOME GAP [ $ ]
0.41
INEQUALITY / GINI INDEX
2,638
LABOR FORCE [ PEOPLE ]
64.4%
PERCENT IN LABOR FORCE
2.1%
UNEMPLOYMENT RATE
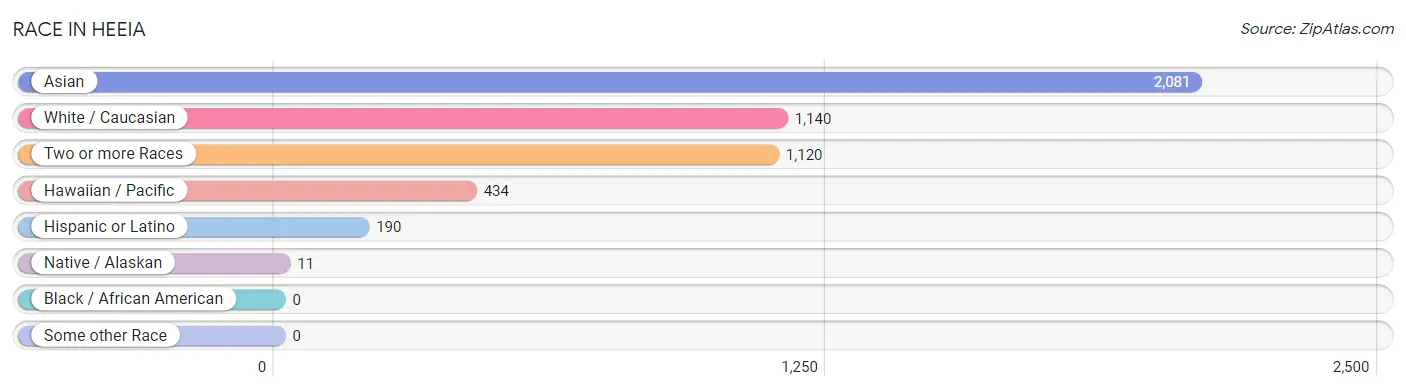
Race in Heeia
The most populous races in Heeia are Asian (2,081 | 43.5%), White / Caucasian (1,140 | 23.8%), and Two or more Races (1,120 | 23.4%).
| Race | # Population | % Population |
| Asian | 2,081 | 43.5% |
| Black / African American | 0 | 0.0% |
| Hawaiian / Pacific | 434 | 9.1% |
| Hispanic or Latino | 190 | 4.0% |
| Native / Alaskan | 11 | 0.2% |
| White / Caucasian | 1,140 | 23.8% |
| Two or more Races | 1,120 | 23.4% |
| Some other Race | 0 | 0.0% |
| Total | 4,786 | 100.0% |
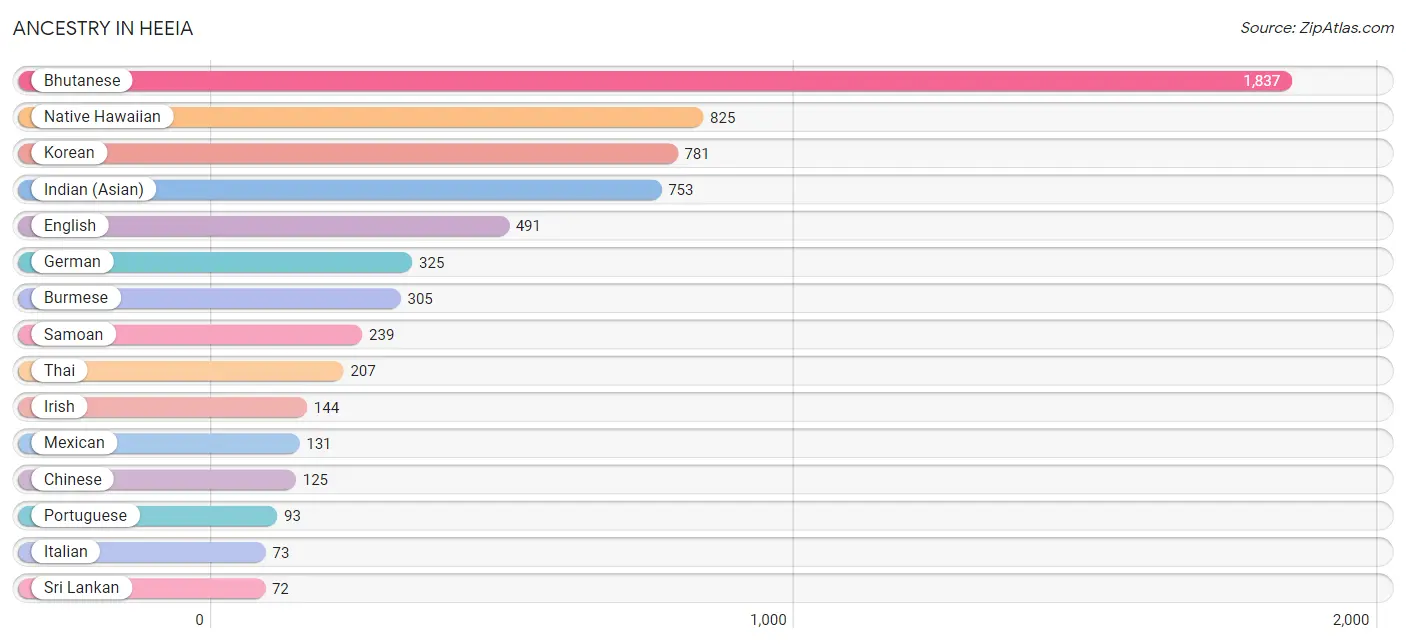
Ancestry in Heeia
The most populous ancestries reported in Heeia are Bhutanese (1,837 | 38.4%), Native Hawaiian (825 | 17.2%), Korean (781 | 16.3%), Indian (Asian) (753 | 15.7%), and English (491 | 10.3%), together accounting for 97.9% of all Heeia residents.
| Ancestry | # Population | % Population |
| African | 64 | 1.3% |
| American | 7 | 0.2% |
| Bhutanese | 1,837 | 38.4% |
| British | 16 | 0.3% |
| Burmese | 305 | 6.4% |
| Chickasaw | 17 | 0.4% |
| Chinese | 125 | 2.6% |
| Czech | 7 | 0.2% |
| Czechoslovakian | 9 | 0.2% |
| Dutch | 27 | 0.6% |
| Eastern European | 8 | 0.2% |
| English | 491 | 10.3% |
| European | 39 | 0.8% |
| French | 71 | 1.5% |
| French Canadian | 9 | 0.2% |
| German | 325 | 6.8% |
| Greek | 38 | 0.8% |
| Indian (Asian) | 753 | 15.7% |
| Irish | 144 | 3.0% |
| Iroquois | 11 | 0.2% |
| Italian | 73 | 1.5% |
| Japanese | 36 | 0.7% |
| Korean | 781 | 16.3% |
| Mexican | 131 | 2.7% |
| Native Hawaiian | 825 | 17.2% |
| Norwegian | 20 | 0.4% |
| Pakistani | 29 | 0.6% |
| Polish | 38 | 0.8% |
| Portuguese | 93 | 1.9% |
| Puerto Rican | 10 | 0.2% |
| Romanian | 33 | 0.7% |
| Samoan | 239 | 5.0% |
| Scandinavian | 23 | 0.5% |
| Scotch-Irish | 8 | 0.2% |
| Scottish | 69 | 1.4% |
| Spaniard | 18 | 0.4% |
| Spanish | 31 | 0.6% |
| Sri Lankan | 72 | 1.5% |
| Subsaharan African | 64 | 1.3% |
| Swedish | 19 | 0.4% |
| Swiss | 8 | 0.2% |
| Thai | 207 | 4.3% |
| Tlingit-Haida | 2 | 0.0% |
| Ukrainian | 7 | 0.2% |
| Yugoslavian | 8 | 0.2% | View All 45 Rows |
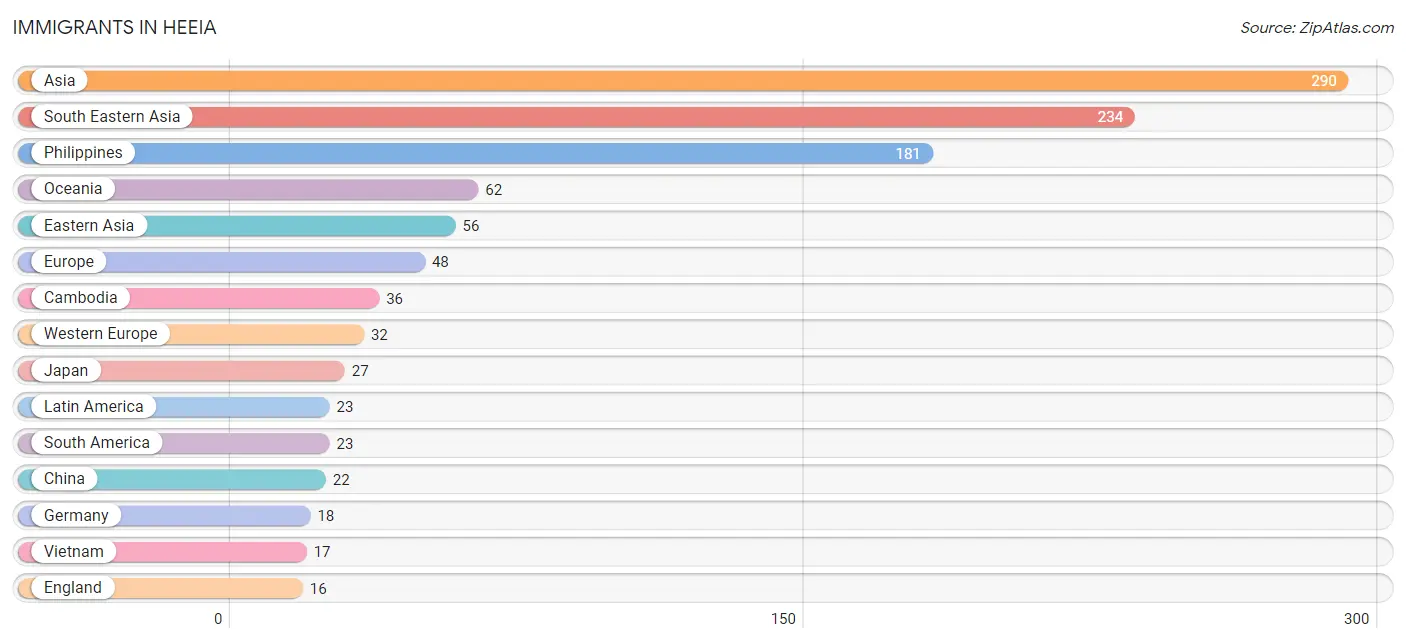
Immigrants in Heeia
The most numerous immigrant groups reported in Heeia came from Asia (290 | 6.1%), South Eastern Asia (234 | 4.9%), Philippines (181 | 3.8%), Oceania (62 | 1.3%), and Eastern Asia (56 | 1.2%), together accounting for 17.2% of all Heeia residents.
| Immigration Origin | # Population | % Population |
| Argentina | 9 | 0.2% |
| Asia | 290 | 6.1% |
| Australia | 7 | 0.2% |
| Cambodia | 36 | 0.7% |
| Canada | 8 | 0.2% |
| China | 22 | 0.5% |
| Eastern Asia | 56 | 1.2% |
| England | 16 | 0.3% |
| Europe | 48 | 1.0% |
| France | 8 | 0.2% |
| Germany | 18 | 0.4% |
| Hong Kong | 12 | 0.3% |
| Japan | 27 | 0.6% |
| Korea | 7 | 0.2% |
| Latin America | 23 | 0.5% |
| Micronesia | 11 | 0.2% |
| Netherlands | 6 | 0.1% |
| Northern Europe | 16 | 0.3% |
| Oceania | 62 | 1.3% |
| Peru | 14 | 0.3% |
| Philippines | 181 | 3.8% |
| South America | 23 | 0.5% |
| South Eastern Asia | 234 | 4.9% |
| Vietnam | 17 | 0.4% |
| Western Europe | 32 | 0.7% | View All 25 Rows |
Sex and Age in Heeia
Sex and Age in Heeia
The most populous age groups in Heeia are 55 to 59 Years (288 | 12.3%) for men and 25 to 29 Years (264 | 10.8%) for women.
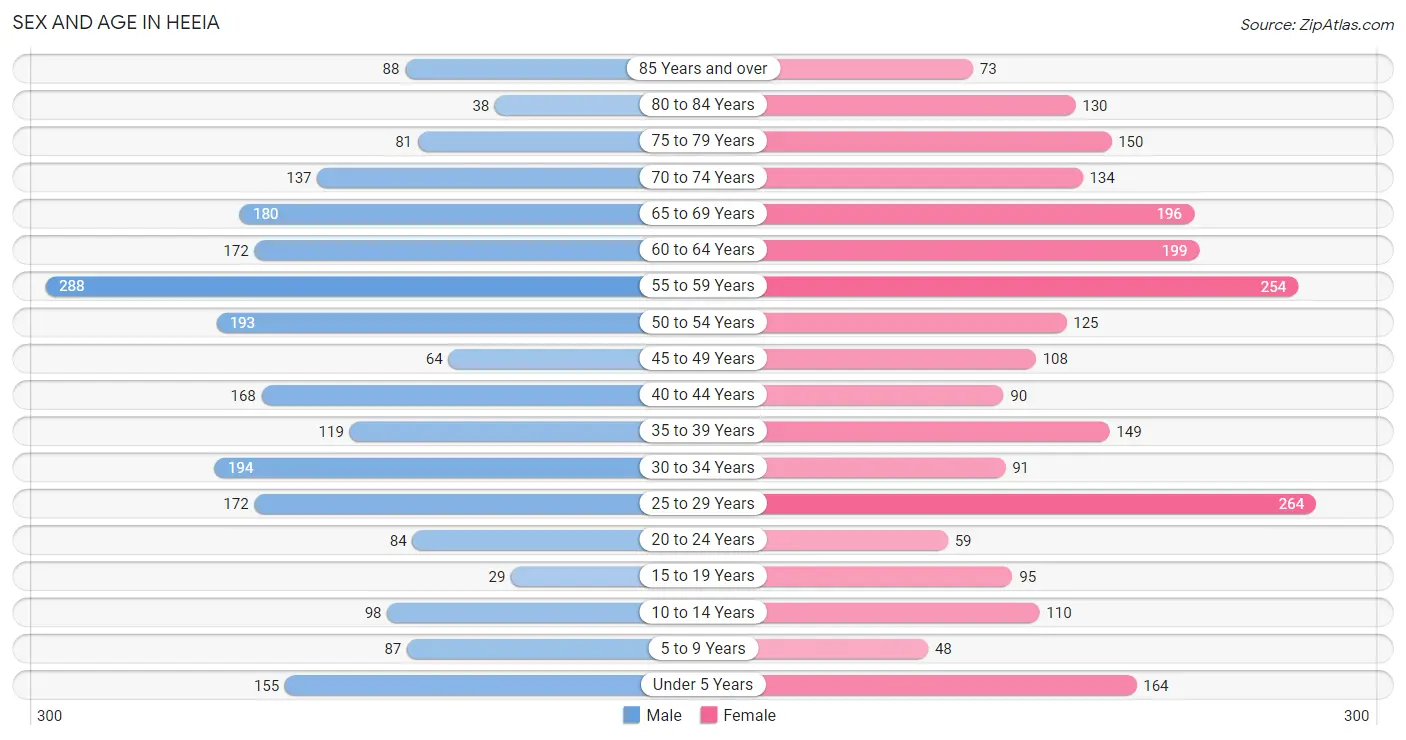
| Age Bracket | Male | Female |
| Under 5 Years | 155 (6.6%) | 164 (6.7%) |
| 5 to 9 Years | 87 (3.7%) | 48 (2.0%) |
| 10 to 14 Years | 98 (4.2%) | 110 (4.5%) |
| 15 to 19 Years | 29 (1.2%) | 95 (3.9%) |
| 20 to 24 Years | 84 (3.6%) | 59 (2.4%) |
| 25 to 29 Years | 172 (7.3%) | 264 (10.8%) |
| 30 to 34 Years | 194 (8.3%) | 91 (3.7%) |
| 35 to 39 Years | 119 (5.1%) | 149 (6.1%) |
| 40 to 44 Years | 168 (7.2%) | 90 (3.7%) |
| 45 to 49 Years | 64 (2.7%) | 108 (4.4%) |
| 50 to 54 Years | 193 (8.2%) | 125 (5.1%) |
| 55 to 59 Years | 288 (12.3%) | 254 (10.4%) |
| 60 to 64 Years | 172 (7.3%) | 199 (8.2%) |
| 65 to 69 Years | 180 (7.7%) | 196 (8.0%) |
| 70 to 74 Years | 137 (5.8%) | 134 (5.5%) |
| 75 to 79 Years | 81 (3.5%) | 150 (6.1%) |
| 80 to 84 Years | 38 (1.6%) | 130 (5.3%) |
| 85 Years and over | 88 (3.7%) | 73 (3.0%) |
| Total | 2,347 (100.0%) | 2,439 (100.0%) |
Families and Households in Heeia
Median Family Size in Heeia
The median family size in Heeia is 3.33 persons per family, with single female/mother families (79 | 6.2%) accounting for the largest median family size of 3.99 persons per family. On the other hand, single male/father families (115 | 9.0%) represent the smallest median family size with 2.37 persons per family.
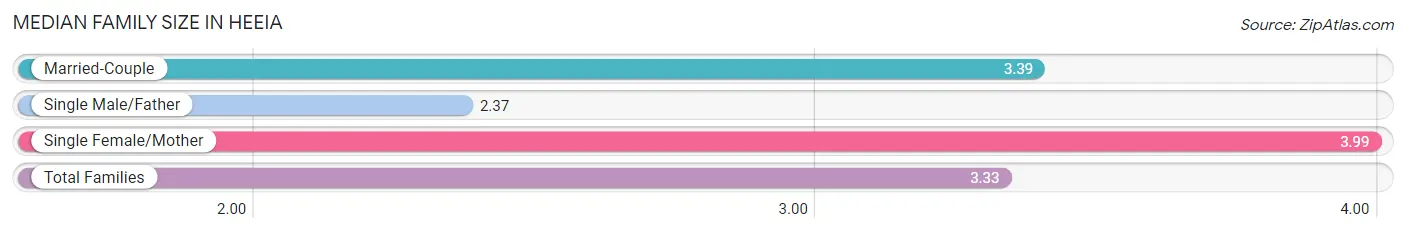
| Family Type | # Families | Family Size |
| Married-Couple | 1,088 (84.9%) | 3.39 |
| Single Male/Father | 115 (9.0%) | 2.37 |
| Single Female/Mother | 79 (6.2%) | 3.99 |
| Total Families | 1,282 (100.0%) | 3.33 |
Median Household Size in Heeia
The median household size in Heeia is 3.04 persons per household, with single female/mother households (79 | 5.0%) accounting for the largest median household size of 4.23 persons per household. non-family households (288 | 18.3%) represent the smallest median household size with 1.38 persons per household.
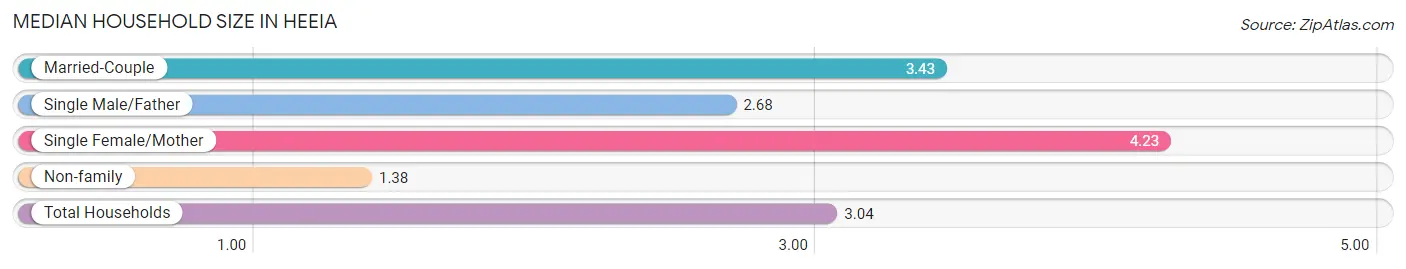
| Household Type | # Households | Household Size |
| Married-Couple | 1,088 (69.3%) | 3.43 |
| Single Male/Father | 115 (7.3%) | 2.68 |
| Single Female/Mother | 79 (5.0%) | 4.23 |
| Non-family | 288 (18.3%) | 1.38 |
| Total Households | 1,570 (100.0%) | 3.04 |
Household Size by Marriage Status in Heeia
Out of a total of 1,570 households in Heeia, 1,282 (81.7%) are family households, while 288 (18.3%) are nonfamily households. The most numerous type of family households are 2-person households, comprising 504, and the most common type of nonfamily households are 1-person households, comprising 215.
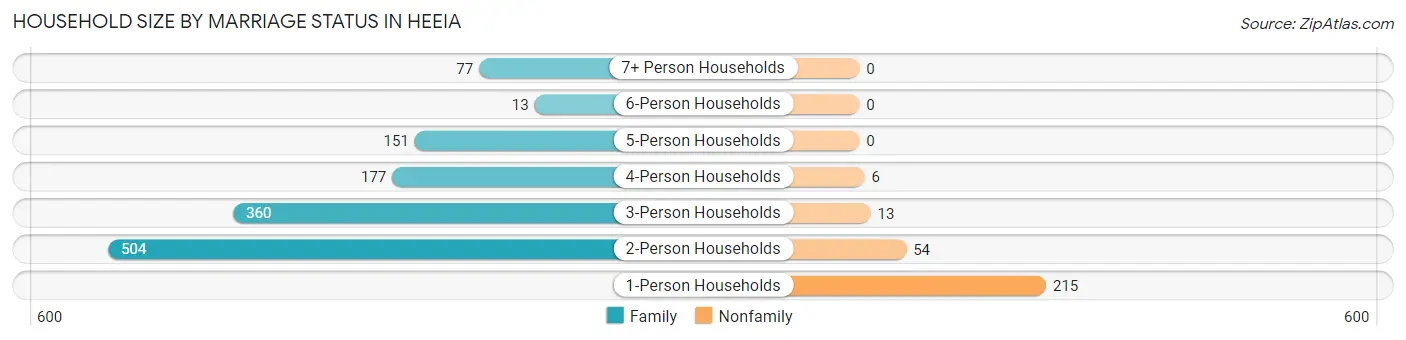
| Household Size | Family Households | Nonfamily Households |
| 1-Person Households | - | 215 (13.7%) |
| 2-Person Households | 504 (32.1%) | 54 (3.4%) |
| 3-Person Households | 360 (22.9%) | 13 (0.8%) |
| 4-Person Households | 177 (11.3%) | 6 (0.4%) |
| 5-Person Households | 151 (9.6%) | 0 (0.0%) |
| 6-Person Households | 13 (0.8%) | 0 (0.0%) |
| 7+ Person Households | 77 (4.9%) | 0 (0.0%) |
| Total | 1,282 (81.7%) | 288 (18.3%) |
Female Fertility in Heeia
Fertility by Age in Heeia
Average fertility rate in Heeia is 29.0 births per 1,000 women. Women in the age bracket of 20 to 34 years have the highest fertility rate with 60.0 births per 1,000 women. Women in the age bracket of 20 to 34 years acount for 100.0% of all women with births.
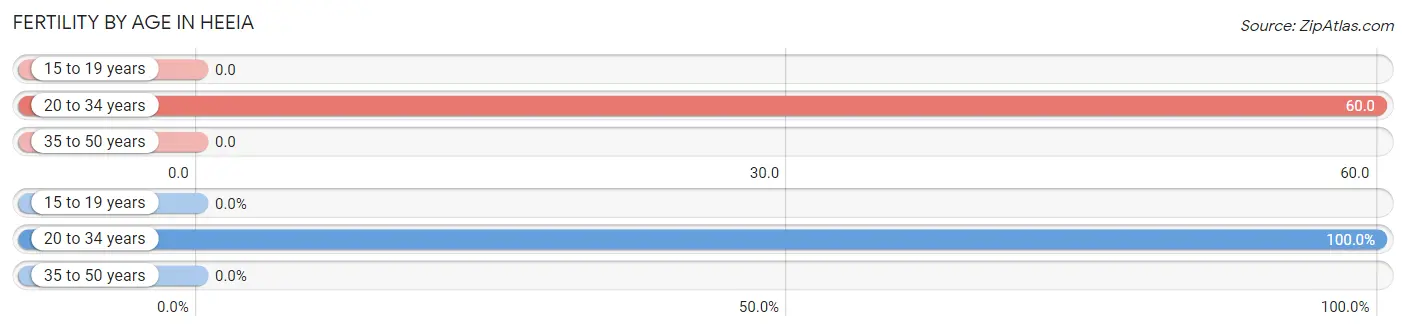
| Age Bracket | Women with Births | Births / 1,000 Women |
| 15 to 19 years | 0 (0.0%) | 0.0 |
| 20 to 34 years | 25 (100.0%) | 60.0 |
| 35 to 50 years | 0 (0.0%) | 0.0 |
| Total | 25 (100.0%) | 29.0 |
Fertility by Age by Marriage Status in Heeia
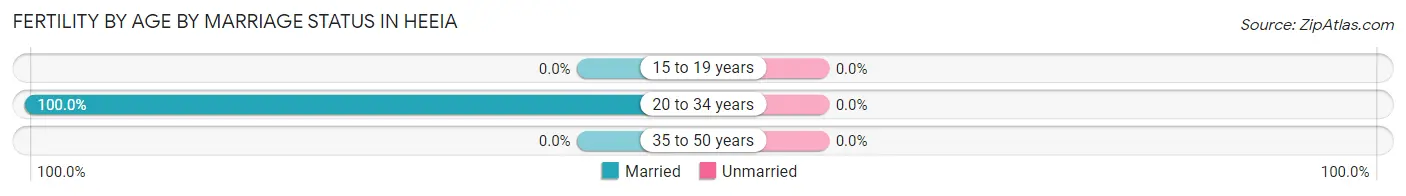
| Age Bracket | Married | Unmarried |
| 15 to 19 years | 0 (0.0%) | 0 (0.0%) |
| 20 to 34 years | 25 (100.0%) | 0 (0.0%) |
| 35 to 50 years | 0 (0.0%) | 0 (0.0%) |
| Total | 25 (100.0%) | 0 (0.0%) |
Fertility by Education in Heeia
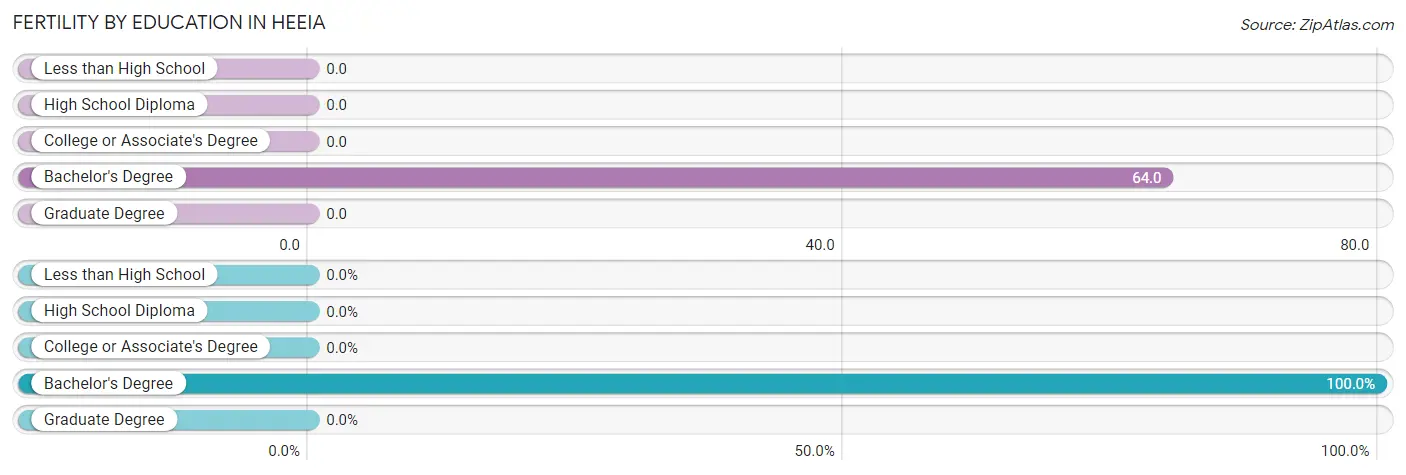
| Educational Attainment | Women with Births | Births / 1,000 Women |
| Less than High School | 0 (0.0%) | 0.0 |
| High School Diploma | 0 (0.0%) | 0.0 |
| College or Associate's Degree | 0 (0.0%) | 0.0 |
| Bachelor's Degree | 25 (100.0%) | 64.0 |
| Graduate Degree | 0 (0.0%) | 0.0 |
| Total | 25 (100.0%) | 29.0 |
Fertility by Education by Marriage Status in Heeia
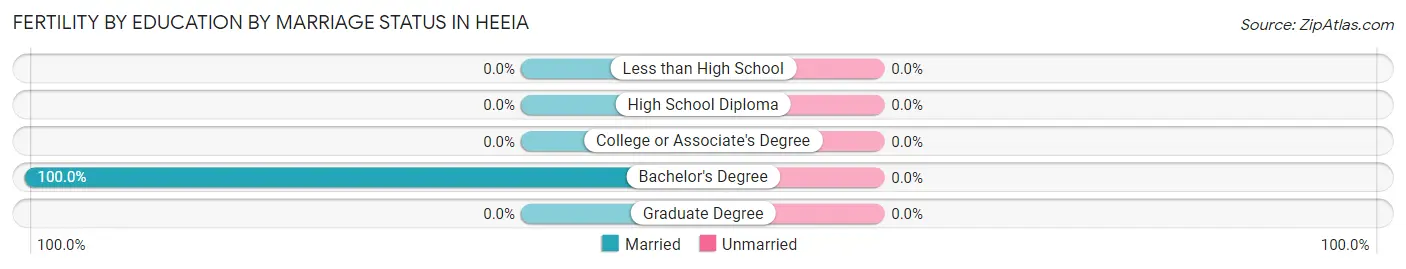
| Educational Attainment | Married | Unmarried |
| Less than High School | 0 (0.0%) | 0 (0.0%) |
| High School Diploma | 0 (0.0%) | 0 (0.0%) |
| College or Associate's Degree | 0 (0.0%) | 0 (0.0%) |
| Bachelor's Degree | 25 (100.0%) | 0 (0.0%) |
| Graduate Degree | 0 (0.0%) | 0 (0.0%) |
| Total | 25 (100.0%) | 0 (0.0%) |
Income in Heeia
Income Overview in Heeia
Per Capita Income in Heeia is $64,918, while median incomes of families and households are $165,833 and $143,214 respectively.
| Characteristic | Number | Measure |
| Per Capita Income | 4,786 | $64,918 |
| Median Family Income | 1,282 | $165,833 |
| Mean Family Income | 1,282 | $205,871 |
| Median Household Income | 1,570 | $143,214 |
| Mean Household Income | 1,570 | $191,155 |
| Income Deficit | 1,282 | $0 |
| Wage / Income Gap (%) | 4,786 | 28.26% |
| Wage / Income Gap ($) | 4,786 | 71.74¢ per $1 |
| Gini / Inequality Index | 4,786 | 0.41 |
Earnings by Sex in Heeia
Average Earnings in Heeia are $70,912, $77,778 for men and $55,795 for women, a difference of 28.3%.
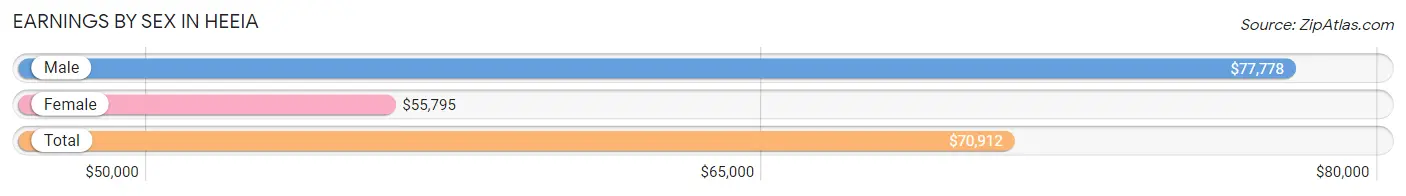
| Sex | Number | Average Earnings |
| Male | 1,456 (52.8%) | $77,778 |
| Female | 1,302 (47.2%) | $55,795 |
| Total | 2,758 (100.0%) | $70,912 |
Earnings by Sex by Income Bracket in Heeia
The most common earnings brackets in Heeia are $100,000+ for men (537 | 36.9%) and $100,000+ for women (322 | 24.7%).
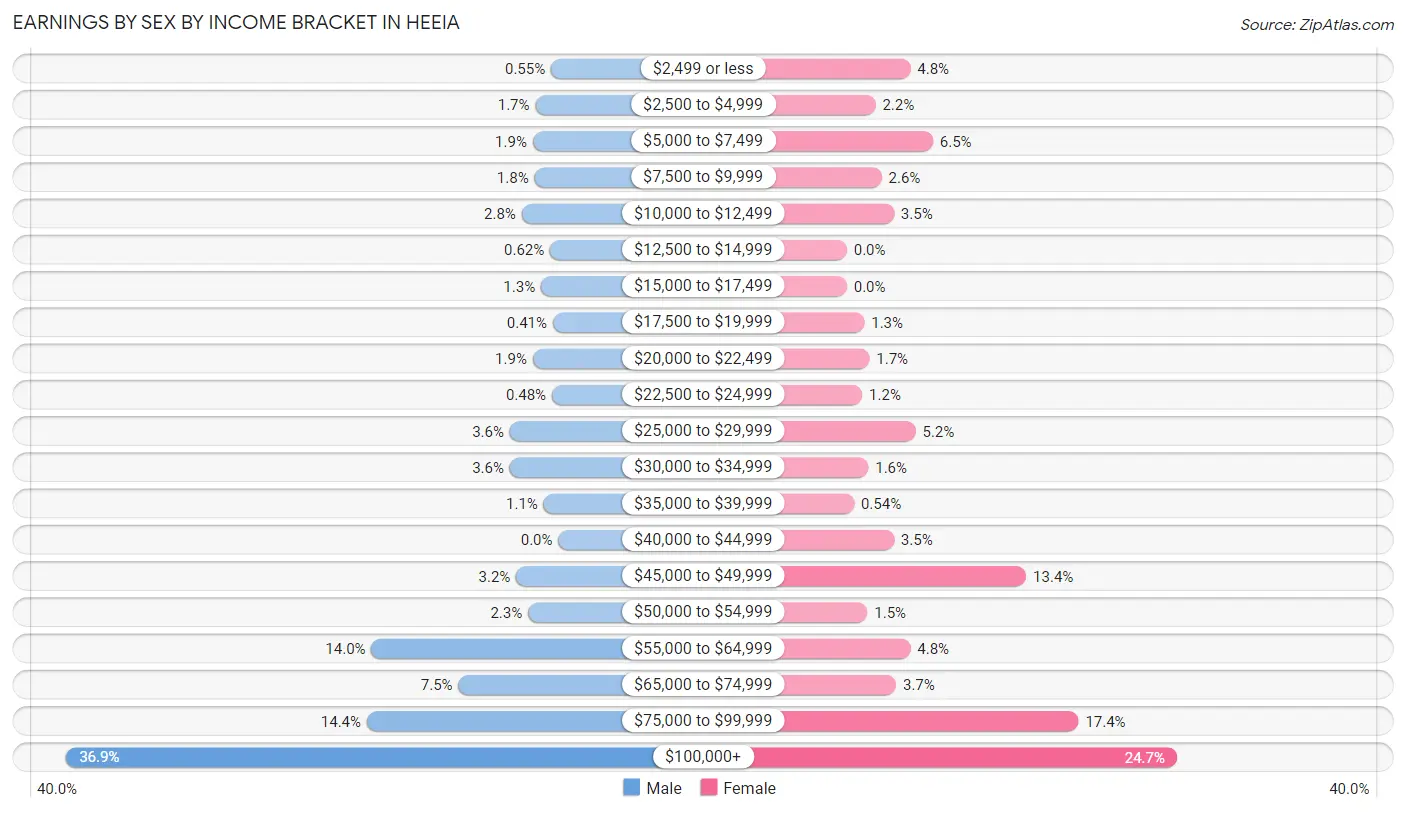
| Income | Male | Female |
| $2,499 or less | 8 (0.5%) | 62 (4.8%) |
| $2,500 to $4,999 | 25 (1.7%) | 28 (2.1%) |
| $5,000 to $7,499 | 28 (1.9%) | 84 (6.5%) |
| $7,500 to $9,999 | 26 (1.8%) | 34 (2.6%) |
| $10,000 to $12,499 | 40 (2.8%) | 46 (3.5%) |
| $12,500 to $14,999 | 9 (0.6%) | 0 (0.0%) |
| $15,000 to $17,499 | 19 (1.3%) | 0 (0.0%) |
| $17,500 to $19,999 | 6 (0.4%) | 17 (1.3%) |
| $20,000 to $22,499 | 28 (1.9%) | 22 (1.7%) |
| $22,500 to $24,999 | 7 (0.5%) | 15 (1.1%) |
| $25,000 to $29,999 | 53 (3.6%) | 67 (5.1%) |
| $30,000 to $34,999 | 53 (3.6%) | 21 (1.6%) |
| $35,000 to $39,999 | 16 (1.1%) | 7 (0.5%) |
| $40,000 to $44,999 | 0 (0.0%) | 46 (3.5%) |
| $45,000 to $49,999 | 46 (3.2%) | 175 (13.4%) |
| $50,000 to $54,999 | 33 (2.3%) | 20 (1.5%) |
| $55,000 to $64,999 | 204 (14.0%) | 62 (4.8%) |
| $65,000 to $74,999 | 109 (7.5%) | 48 (3.7%) |
| $75,000 to $99,999 | 209 (14.3%) | 226 (17.4%) |
| $100,000+ | 537 (36.9%) | 322 (24.7%) |
| Total | 1,456 (100.0%) | 1,302 (100.0%) |
Earnings by Sex by Educational Attainment in Heeia
Average earnings in Heeia are $80,683 for men and $63,207 for women, a difference of 21.7%. Men with an educational attainment of graduate degree enjoy the highest average annual earnings of $116,842, while those with high school diploma education earn the least with $61,250. Women with an educational attainment of graduate degree earn the most with the average annual earnings of $95,625, while those with bachelor's degree education have the smallest earnings of $46,800.
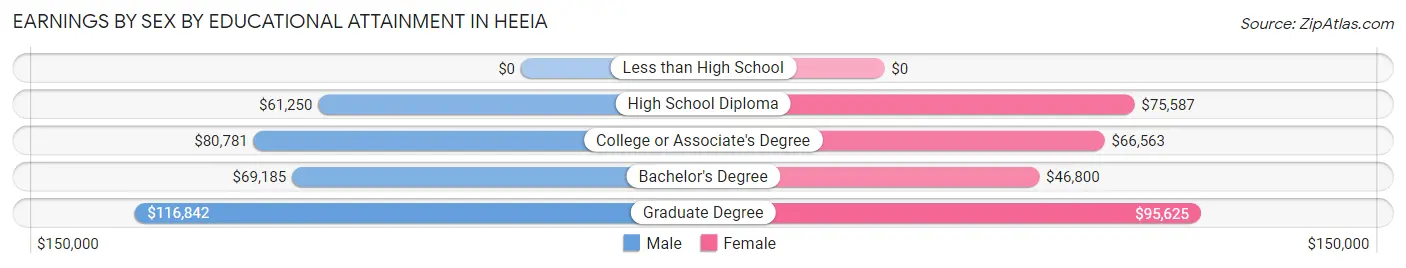
| Educational Attainment | Male Income | Female Income |
| Less than High School | - | - |
| High School Diploma | $61,250 | $75,587 |
| College or Associate's Degree | $80,781 | $66,563 |
| Bachelor's Degree | $69,185 | $46,800 |
| Graduate Degree | $116,842 | $95,625 |
| Total | $80,683 | $63,207 |
Family Income in Heeia
Family Income Brackets in Heeia
According to the Heeia family income data, there are 470 families falling into the $200,000+ income range, which is the most common income bracket and makes up 36.7% of all families.
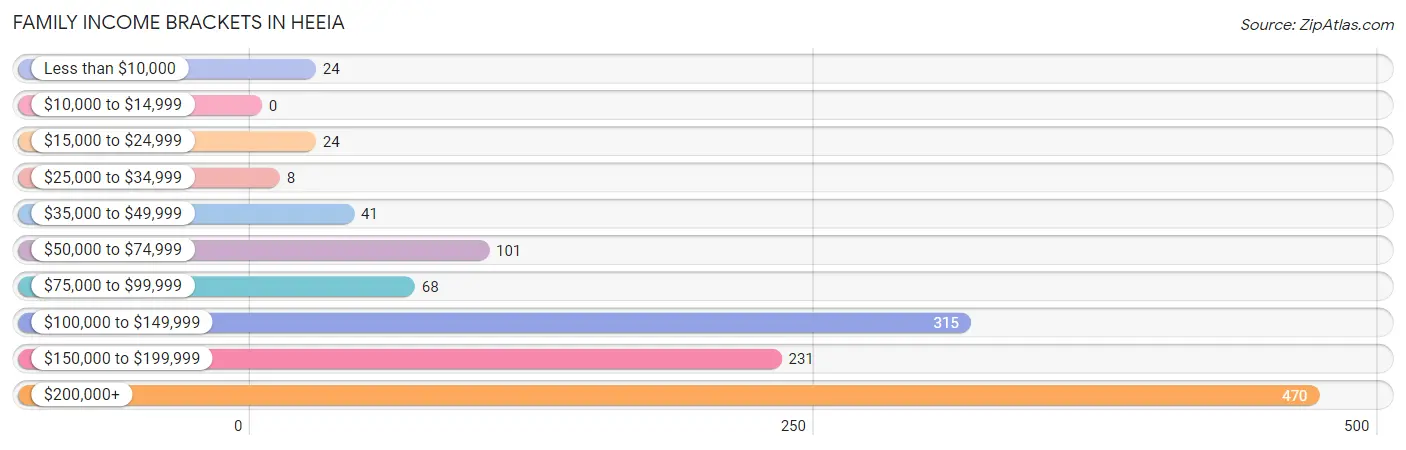
| Income Bracket | # Families | % Families |
| Less than $10,000 | 24 | 1.9% |
| $10,000 to $14,999 | 0 | 0.0% |
| $15,000 to $24,999 | 24 | 1.9% |
| $25,000 to $34,999 | 8 | 0.6% |
| $35,000 to $49,999 | 41 | 3.2% |
| $50,000 to $74,999 | 101 | 7.9% |
| $75,000 to $99,999 | 68 | 5.3% |
| $100,000 to $149,999 | 315 | 24.6% |
| $150,000 to $199,999 | 231 | 18.0% |
| $200,000+ | 470 | 36.7% |
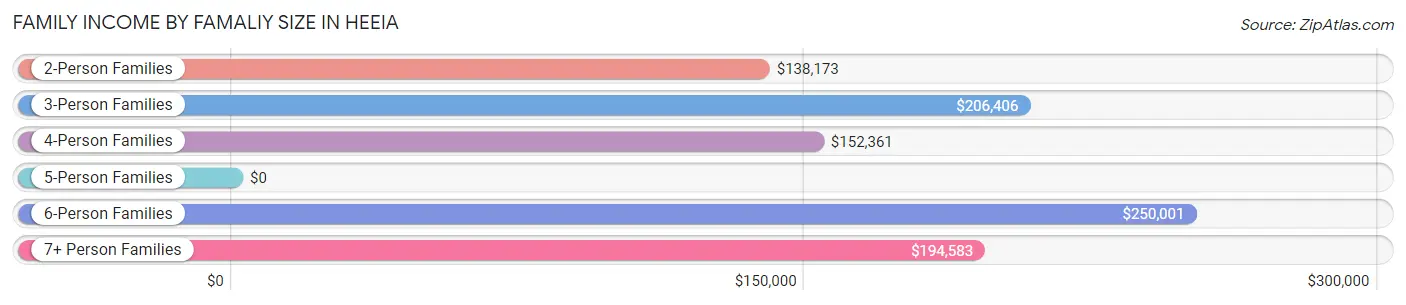
Family Income by Famaliy Size in Heeia
6-person families (38 | 3.0%) account for the highest median family income in Heeia with $250,001 per family, while 2-person families (519 | 40.5%) have the highest median income of $69,086 per family member.
| Income Bracket | # Families | Median Income |
| 2-Person Families | 519 (40.5%) | $138,173 |
| 3-Person Families | 360 (28.1%) | $206,406 |
| 4-Person Families | 183 (14.3%) | $152,361 |
| 5-Person Families | 137 (10.7%) | $0 |
| 6-Person Families | 38 (3.0%) | $250,001 |
| 7+ Person Families | 45 (3.5%) | $194,583 |
| Total | 1,282 (100.0%) | $165,833 |
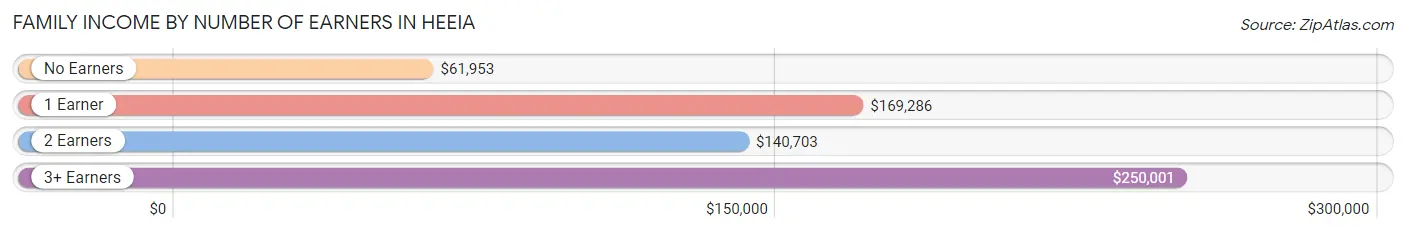
Family Income by Number of Earners in Heeia
The median family income in Heeia is $165,833, with families comprising 3+ earners (252) having the highest median family income of $250,001, while families with no earners (181) have the lowest median family income of $61,953, accounting for 19.7% and 14.1% of families, respectively.
| Number of Earners | # Families | Median Income |
| No Earners | 181 (14.1%) | $61,953 |
| 1 Earner | 296 (23.1%) | $169,286 |
| 2 Earners | 553 (43.1%) | $140,703 |
| 3+ Earners | 252 (19.7%) | $250,001 |
| Total | 1,282 (100.0%) | $165,833 |
Household Income in Heeia
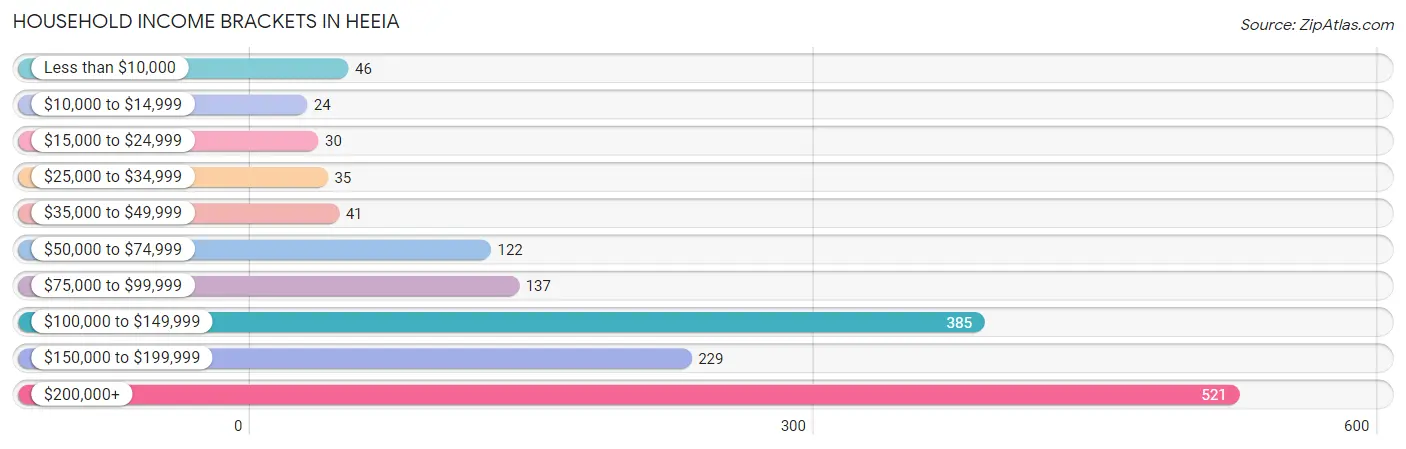
Household Income Brackets in Heeia
With 521 households falling in the category, the $200,000+ income range is the most frequent in Heeia, accounting for 33.2% of all households. In contrast, only 24 households (1.5%) fall into the $10,000 to $14,999 income bracket, making it the least populous group.
| Income Bracket | # Households | % Households |
| Less than $10,000 | 46 | 2.9% |
| $10,000 to $14,999 | 24 | 1.5% |
| $15,000 to $24,999 | 30 | 1.9% |
| $25,000 to $34,999 | 35 | 2.2% |
| $35,000 to $49,999 | 41 | 2.6% |
| $50,000 to $74,999 | 122 | 7.8% |
| $75,000 to $99,999 | 137 | 8.7% |
| $100,000 to $149,999 | 385 | 24.5% |
| $150,000 to $199,999 | 229 | 14.6% |
| $200,000+ | 521 | 33.2% |
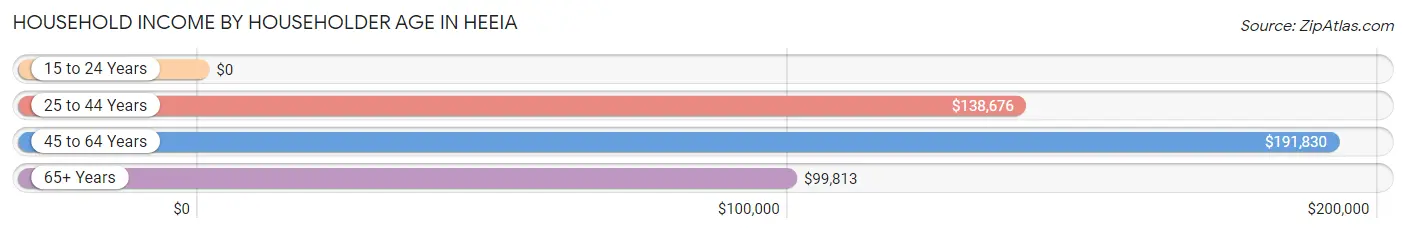
Household Income by Householder Age in Heeia
The median household income in Heeia is $143,214, with the highest median household income of $191,830 found in the 45 to 64 years age bracket for the primary householder. A total of 646 households (41.1%) fall into this category. Meanwhile, the 15 to 24 years age bracket for the primary householder has the lowest median household income of $0, with 23 households (1.5%) in this group.
| Income Bracket | # Households | Median Income |
| 15 to 24 Years | 23 (1.5%) | $0 |
| 25 to 44 Years | 246 (15.7%) | $138,676 |
| 45 to 64 Years | 646 (41.1%) | $191,830 |
| 65+ Years | 655 (41.7%) | $99,813 |
| Total | 1,570 (100.0%) | $143,214 |
Poverty in Heeia
Income Below Poverty by Sex and Age in Heeia
With 2.6% poverty level for males and 5.5% for females among the residents of Heeia, 6 to 11 year old males and 15 year old females are the most vulnerable to poverty, with 9 males (14.3%) and 8 females (57.1%) in their respective age groups living below the poverty level.
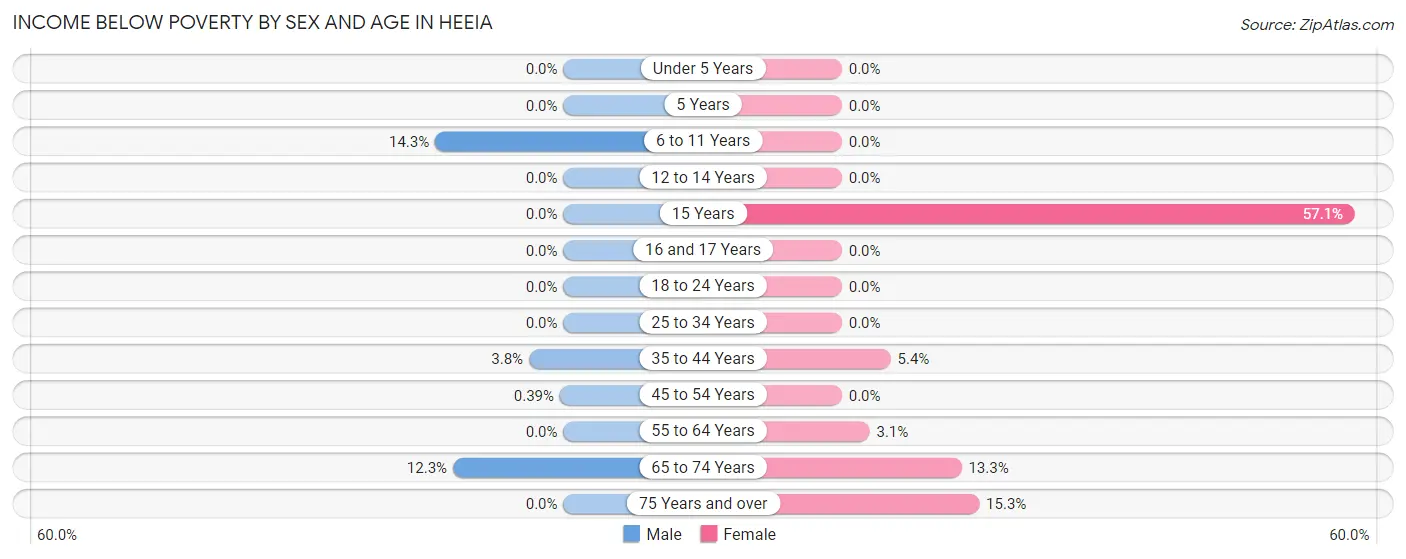
| Age Bracket | Male | Female |
| Under 5 Years | 0 (0.0%) | 0 (0.0%) |
| 5 Years | 0 (0.0%) | 0 (0.0%) |
| 6 to 11 Years | 9 (14.3%) | 0 (0.0%) |
| 12 to 14 Years | 0 (0.0%) | 0 (0.0%) |
| 15 Years | 0 (0.0%) | 8 (57.1%) |
| 16 and 17 Years | 0 (0.0%) | 0 (0.0%) |
| 18 to 24 Years | 0 (0.0%) | 0 (0.0%) |
| 25 to 34 Years | 0 (0.0%) | 0 (0.0%) |
| 35 to 44 Years | 11 (3.8%) | 13 (5.4%) |
| 45 to 54 Years | 1 (0.4%) | 0 (0.0%) |
| 55 to 64 Years | 0 (0.0%) | 14 (3.1%) |
| 65 to 74 Years | 39 (12.3%) | 44 (13.3%) |
| 75 Years and over | 0 (0.0%) | 54 (15.3%) |
| Total | 60 (2.6%) | 133 (5.5%) |
Income Above Poverty by Sex and Age in Heeia
According to the poverty statistics in Heeia, males aged under 5 years and females aged under 5 years are the age groups that are most secure financially, with 100.0% of males and 100.0% of females in these age groups living above the poverty line.
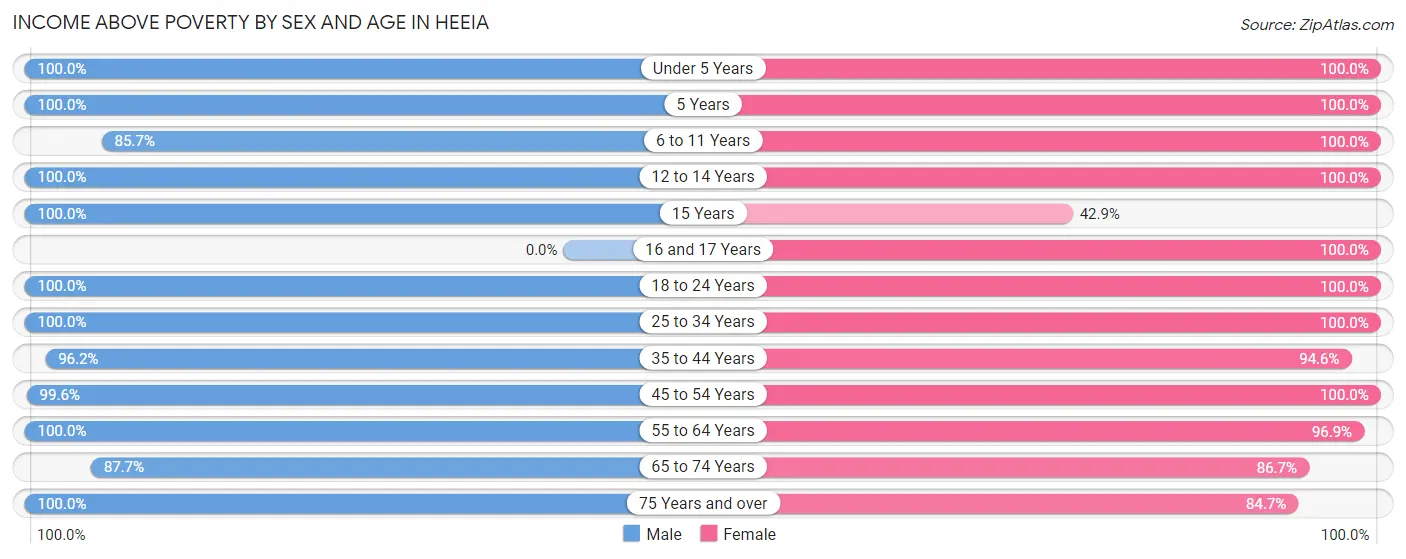
| Age Bracket | Male | Female |
| Under 5 Years | 155 (100.0%) | 155 (100.0%) |
| 5 Years | 51 (100.0%) | 8 (100.0%) |
| 6 to 11 Years | 54 (85.7%) | 91 (100.0%) |
| 12 to 14 Years | 71 (100.0%) | 51 (100.0%) |
| 15 Years | 13 (100.0%) | 6 (42.9%) |
| 16 and 17 Years | 0 (0.0%) | 52 (100.0%) |
| 18 to 24 Years | 100 (100.0%) | 88 (100.0%) |
| 25 to 34 Years | 366 (100.0%) | 355 (100.0%) |
| 35 to 44 Years | 276 (96.2%) | 226 (94.6%) |
| 45 to 54 Years | 256 (99.6%) | 233 (100.0%) |
| 55 to 64 Years | 460 (100.0%) | 439 (96.9%) |
| 65 to 74 Years | 278 (87.7%) | 286 (86.7%) |
| 75 Years and over | 207 (100.0%) | 299 (84.7%) |
| Total | 2,287 (97.4%) | 2,289 (94.5%) |
Income Below Poverty Among Married-Couple Families in Heeia
The poverty statistics for married-couple families in Heeia show that 2.2% or 24 of the total 1,088 families live below the poverty line. Families with no children have the highest poverty rate of 3.0%, comprising of 24 families. On the other hand, families with 1 or 2 children have the lowest poverty rate of 0.0%, which includes 0 families.
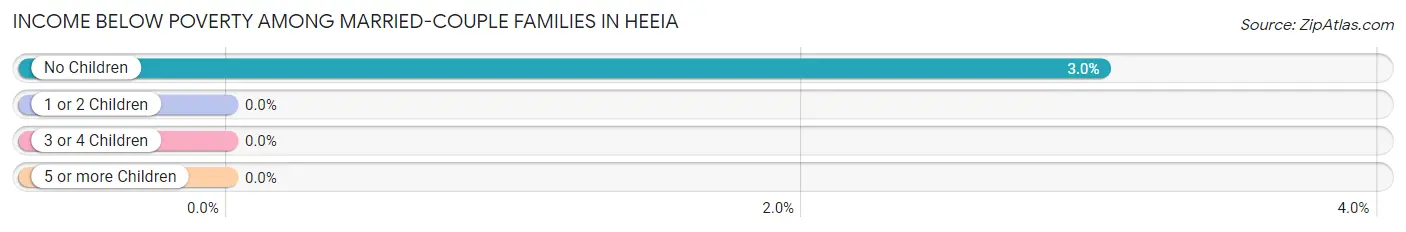
| Children | Above Poverty | Below Poverty |
| No Children | 765 (97.0%) | 24 (3.0%) |
| 1 or 2 Children | 203 (100.0%) | 0 (0.0%) |
| 3 or 4 Children | 96 (100.0%) | 0 (0.0%) |
| 5 or more Children | 0 (0.0%) | 0 (0.0%) |
| Total | 1,064 (97.8%) | 24 (2.2%) |
Income Below Poverty Among Single-Parent Households in Heeia
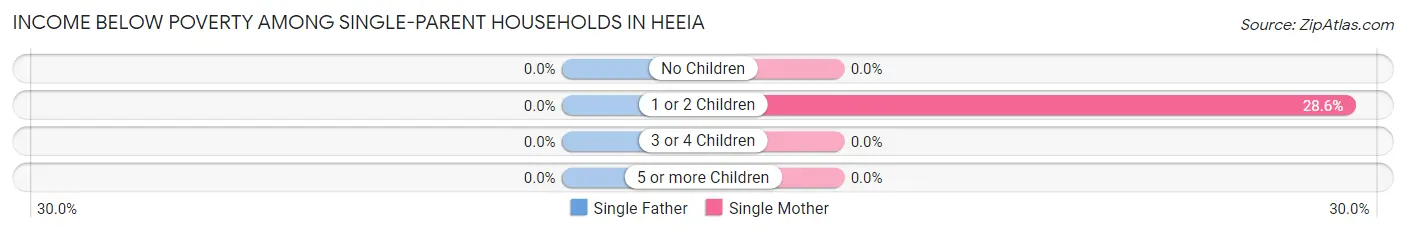
| Children | Single Father | Single Mother |
| No Children | 0 (0.0%) | 0 (0.0%) |
| 1 or 2 Children | 0 (0.0%) | 8 (28.6%) |
| 3 or 4 Children | 0 (0.0%) | 0 (0.0%) |
| 5 or more Children | 0 (0.0%) | 0 (0.0%) |
| Total | 0 (0.0%) | 8 (10.1%) |
Income Below Poverty Among Married-Couple vs Single-Parent Households in Heeia
The poverty data for Heeia shows that 24 of the married-couple family households (2.2%) and 8 of the single-parent households (4.1%) are living below the poverty level. Within the married-couple family households, those with no children have the highest poverty rate, with 24 households (3.0%) falling below the poverty line. Among the single-parent households, those with 1 or 2 children have the highest poverty rate, with 8 household (10.4%) living below poverty.
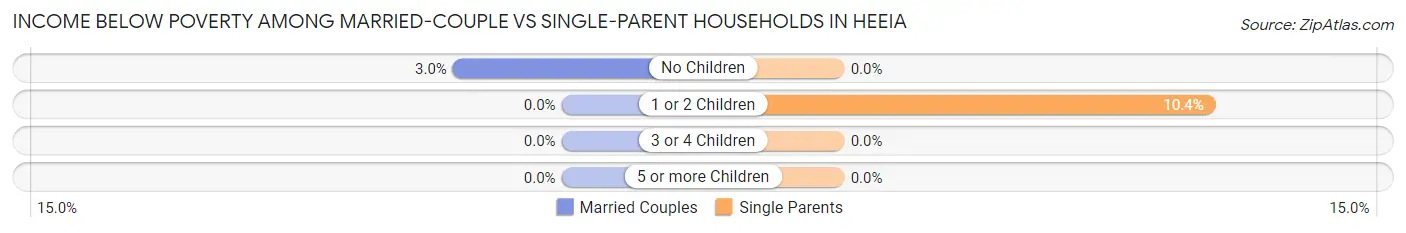
| Children | Married-Couple Families | Single-Parent Households |
| No Children | 24 (3.0%) | 0 (0.0%) |
| 1 or 2 Children | 0 (0.0%) | 8 (10.4%) |
| 3 or 4 Children | 0 (0.0%) | 0 (0.0%) |
| 5 or more Children | 0 (0.0%) | 0 (0.0%) |
| Total | 24 (2.2%) | 8 (4.1%) |
Employment Characteristics in Heeia
Employment by Class of Employer in Heeia
Among the 2,523 employed individuals in Heeia, private company employees (1,226 | 48.6%), federal government employees (462 | 18.3%), and state government employees (244 | 9.7%) make up the most common classes of employment.
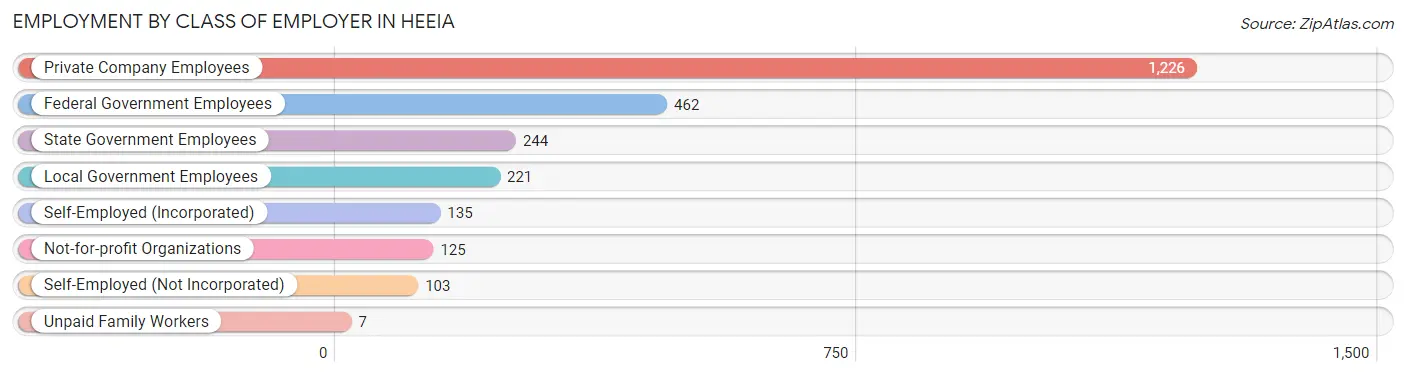
| Employer Class | # Employees | % Employees |
| Private Company Employees | 1,226 | 48.6% |
| Self-Employed (Incorporated) | 135 | 5.3% |
| Self-Employed (Not Incorporated) | 103 | 4.1% |
| Not-for-profit Organizations | 125 | 5.0% |
| Local Government Employees | 221 | 8.8% |
| State Government Employees | 244 | 9.7% |
| Federal Government Employees | 462 | 18.3% |
| Unpaid Family Workers | 7 | 0.3% |
| Total | 2,523 | 100.0% |
Employment Status by Age in Heeia
According to the labor force statistics for Heeia, out of the total population over 16 years of age (4,097), 64.4% or 2,638 individuals are in the labor force, with 2.1% or 55 of them unemployed. The age group with the highest labor force participation rate is 30 to 34 years, with 100.0% or 285 individuals in the labor force. Within the labor force, the 35 to 44 years age range has the highest percentage of unemployed individuals, with 8.5% or 39 of them being unemployed.
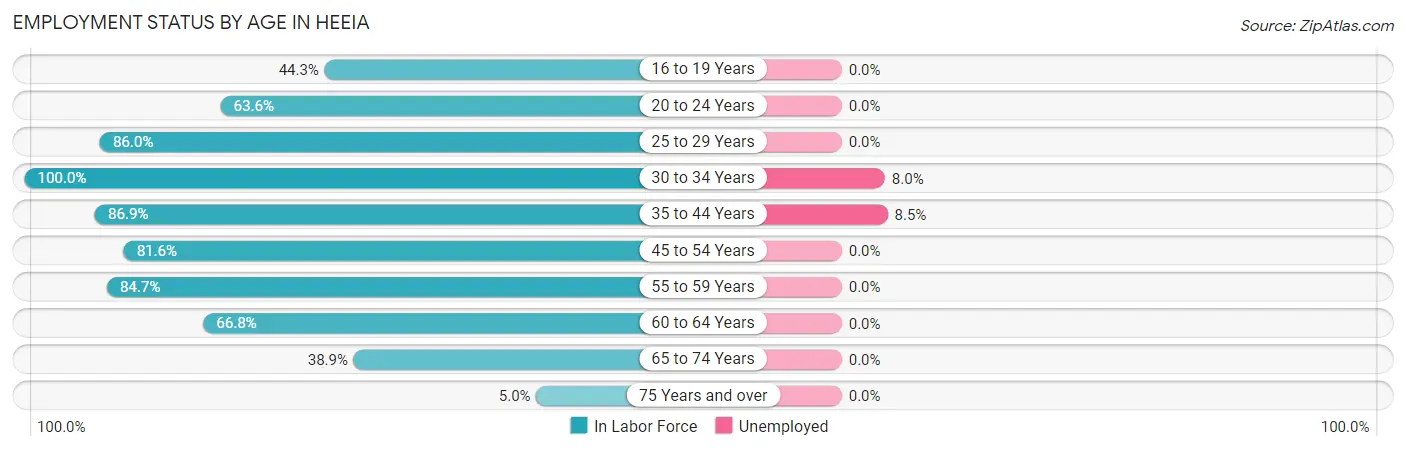
| Age Bracket | In Labor Force | Unemployed |
| 16 to 19 Years | 43 (44.3%) | 0 (0.0%) |
| 20 to 24 Years | 91 (63.6%) | 0 (0.0%) |
| 25 to 29 Years | 375 (86.0%) | 0 (0.0%) |
| 30 to 34 Years | 285 (100.0%) | 23 (8.0%) |
| 35 to 44 Years | 457 (86.9%) | 39 (8.5%) |
| 45 to 54 Years | 400 (81.6%) | 0 (0.0%) |
| 55 to 59 Years | 459 (84.7%) | 0 (0.0%) |
| 60 to 64 Years | 248 (66.8%) | 0 (0.0%) |
| 65 to 74 Years | 252 (38.9%) | 0 (0.0%) |
| 75 Years and over | 28 (5.0%) | 0 (0.0%) |
| Total | 2,638 (64.4%) | 55 (2.1%) |
Employment Status by Educational Attainment in Heeia
According to labor force statistics for Heeia, 83.9% of individuals (2,223) out of the total population between 25 and 64 years of age (2,650) are in the labor force, with 2.5% or 56 of them being unemployed. The group with the highest labor force participation rate are those with the educational attainment of less than high school, with 100.0% or 9 individuals in the labor force. Within the labor force, individuals with college / associate degree education have the highest percentage of unemployment, with 6.5% or 36 of them being unemployed.
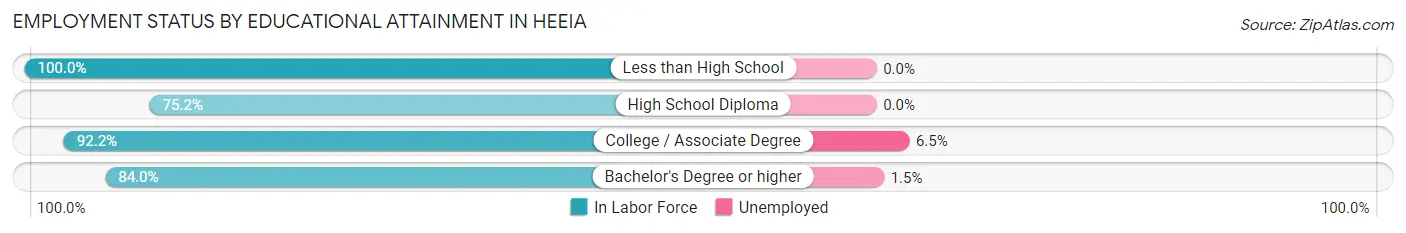
| Educational Attainment | In Labor Force | Unemployed |
| Less than High School | 9 (100.0%) | 0 (0.0%) |
| High School Diploma | 445 (75.2%) | 0 (0.0%) |
| College / Associate Degree | 553 (92.2%) | 39 (6.5%) |
| Bachelor's Degree or higher | 1,217 (84.0%) | 22 (1.5%) |
| Total | 2,223 (83.9%) | 66 (2.5%) |
Employment Occupations by Sex in Heeia
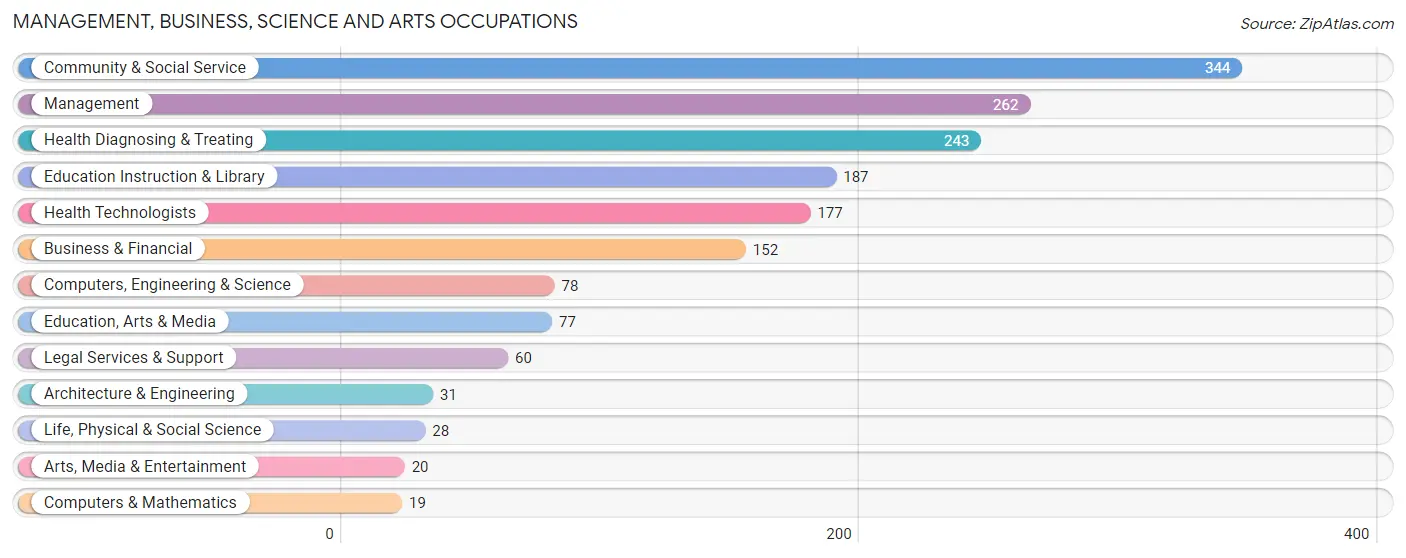
Management, Business, Science and Arts Occupations
The most common Management, Business, Science and Arts occupations in Heeia are Community & Social Service (344 | 13.9%), Management (262 | 10.6%), Health Diagnosing & Treating (243 | 9.8%), Education Instruction & Library (187 | 7.6%), and Health Technologists (177 | 7.2%).
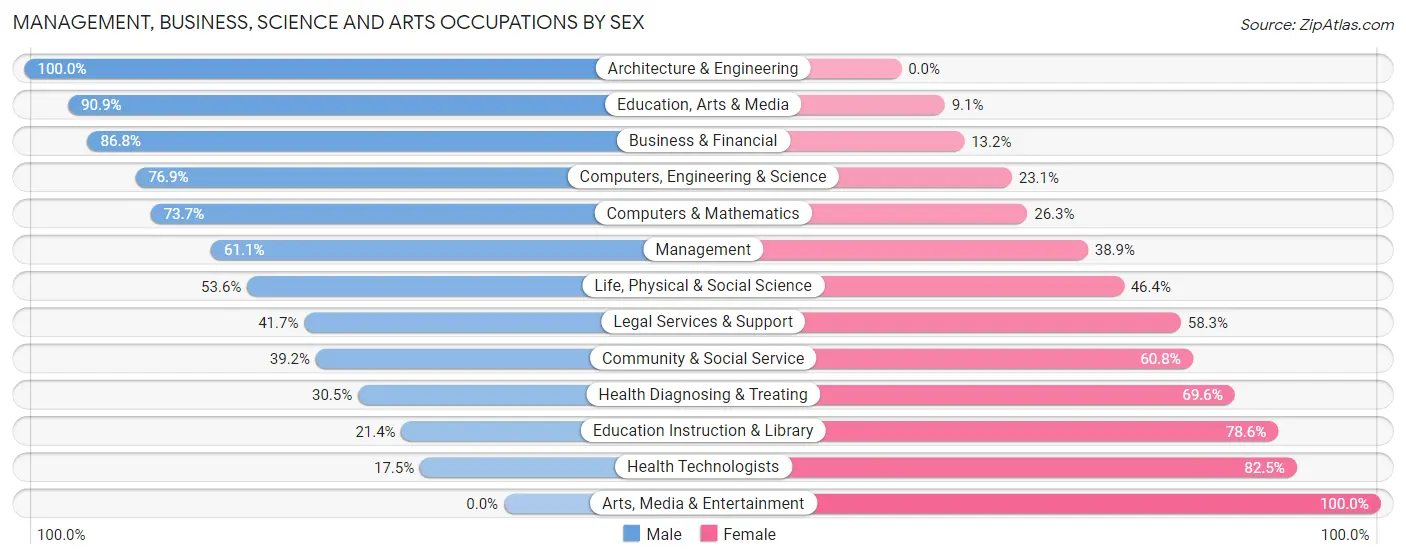
Management, Business, Science and Arts Occupations by Sex
Within the Management, Business, Science and Arts occupations in Heeia, the most male-oriented occupations are Architecture & Engineering (100.0%), Education, Arts & Media (90.9%), and Business & Financial (86.8%), while the most female-oriented occupations are Arts, Media & Entertainment (100.0%), Health Technologists (82.5%), and Education Instruction & Library (78.6%).
| Occupation | Male | Female |
| Management | 160 (61.1%) | 102 (38.9%) |
| Business & Financial | 132 (86.8%) | 20 (13.2%) |
| Computers, Engineering & Science | 60 (76.9%) | 18 (23.1%) |
| Computers & Mathematics | 14 (73.7%) | 5 (26.3%) |
| Architecture & Engineering | 31 (100.0%) | 0 (0.0%) |
| Life, Physical & Social Science | 15 (53.6%) | 13 (46.4%) |
| Community & Social Service | 135 (39.2%) | 209 (60.8%) |
| Education, Arts & Media | 70 (90.9%) | 7 (9.1%) |
| Legal Services & Support | 25 (41.7%) | 35 (58.3%) |
| Education Instruction & Library | 40 (21.4%) | 147 (78.6%) |
| Arts, Media & Entertainment | 0 (0.0%) | 20 (100.0%) |
| Health Diagnosing & Treating | 74 (30.4%) | 169 (69.6%) |
| Health Technologists | 31 (17.5%) | 146 (82.5%) |
| Total (Category) | 561 (52.0%) | 518 (48.0%) |
| Total (Overall) | 1,329 (53.8%) | 1,143 (46.2%) |
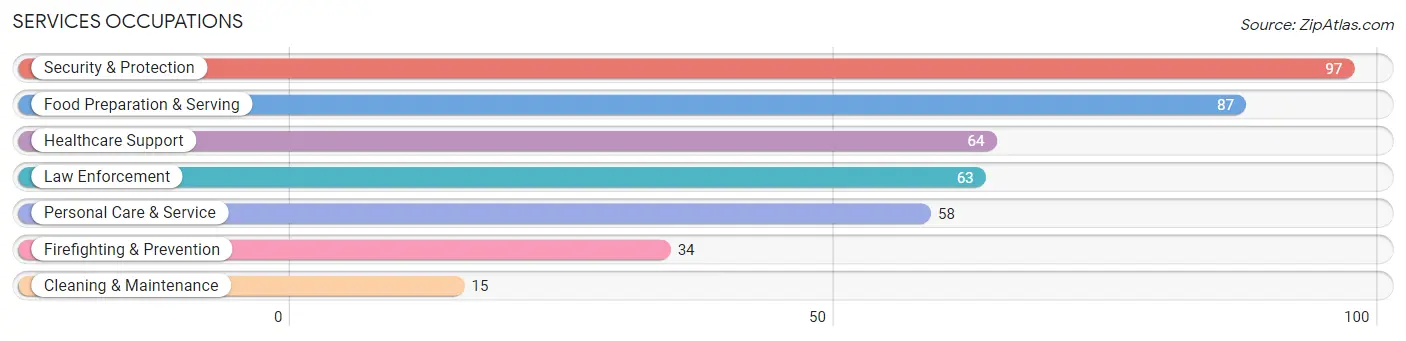
Services Occupations
The most common Services occupations in Heeia are Security & Protection (97 | 3.9%), Food Preparation & Serving (87 | 3.5%), Healthcare Support (64 | 2.6%), Law Enforcement (63 | 2.5%), and Personal Care & Service (58 | 2.4%).
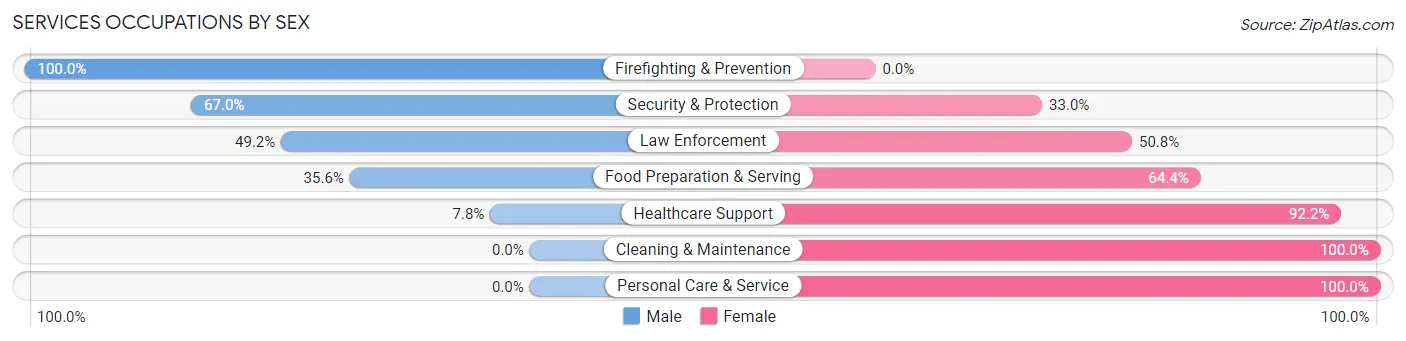
Services Occupations by Sex
Within the Services occupations in Heeia, the most male-oriented occupations are Firefighting & Prevention (100.0%), Security & Protection (67.0%), and Law Enforcement (49.2%), while the most female-oriented occupations are Cleaning & Maintenance (100.0%), Personal Care & Service (100.0%), and Healthcare Support (92.2%).
| Occupation | Male | Female |
| Healthcare Support | 5 (7.8%) | 59 (92.2%) |
| Security & Protection | 65 (67.0%) | 32 (33.0%) |
| Firefighting & Prevention | 34 (100.0%) | 0 (0.0%) |
| Law Enforcement | 31 (49.2%) | 32 (50.8%) |
| Food Preparation & Serving | 31 (35.6%) | 56 (64.4%) |
| Cleaning & Maintenance | 0 (0.0%) | 15 (100.0%) |
| Personal Care & Service | 0 (0.0%) | 58 (100.0%) |
| Total (Category) | 101 (31.5%) | 220 (68.5%) |
| Total (Overall) | 1,329 (53.8%) | 1,143 (46.2%) |
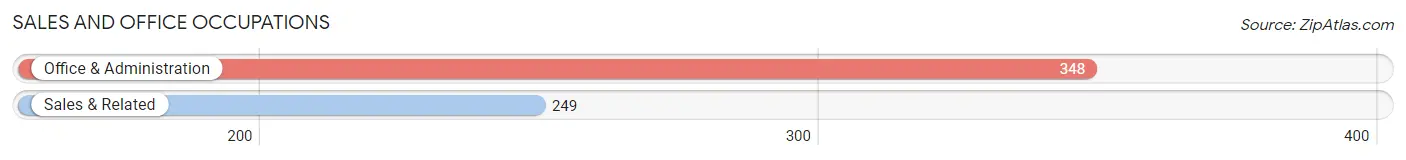
Sales and Office Occupations
The most common Sales and Office occupations in Heeia are Office & Administration (348 | 14.1%), and Sales & Related (249 | 10.1%).
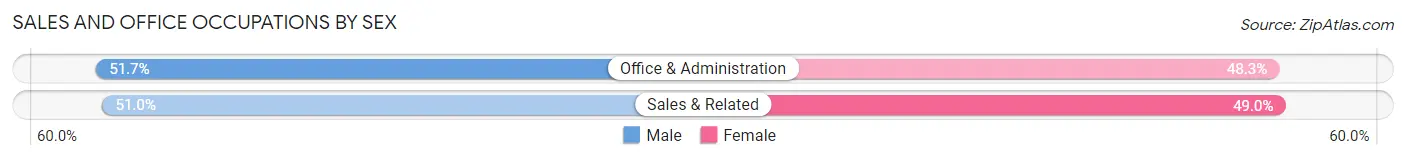
Sales and Office Occupations by Sex
| Occupation | Male | Female |
| Sales & Related | 127 (51.0%) | 122 (49.0%) |
| Office & Administration | 180 (51.7%) | 168 (48.3%) |
| Total (Category) | 307 (51.4%) | 290 (48.6%) |
| Total (Overall) | 1,329 (53.8%) | 1,143 (46.2%) |
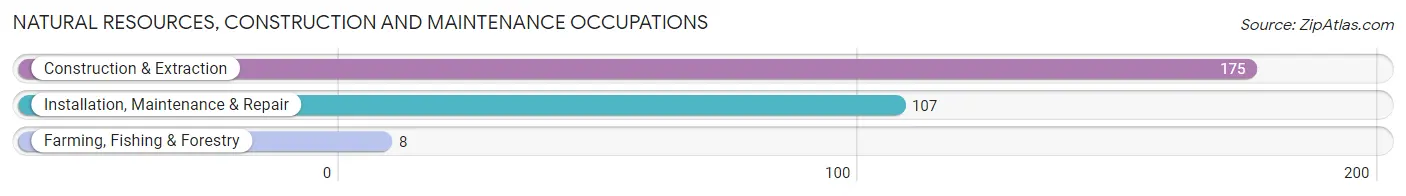
Natural Resources, Construction and Maintenance Occupations
The most common Natural Resources, Construction and Maintenance occupations in Heeia are Construction & Extraction (175 | 7.1%), Installation, Maintenance & Repair (107 | 4.3%), and Farming, Fishing & Forestry (8 | 0.3%).
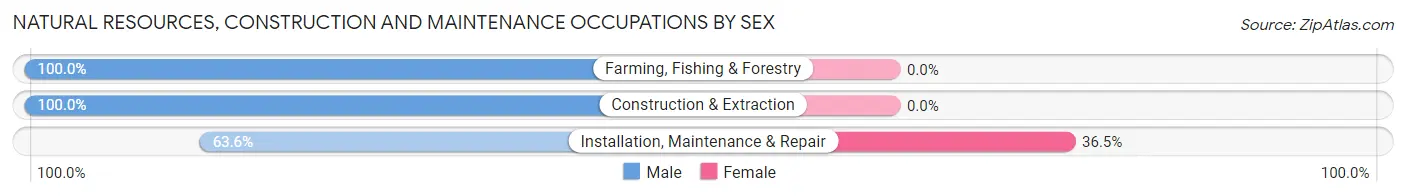
Natural Resources, Construction and Maintenance Occupations by Sex
| Occupation | Male | Female |
| Farming, Fishing & Forestry | 8 (100.0%) | 0 (0.0%) |
| Construction & Extraction | 175 (100.0%) | 0 (0.0%) |
| Installation, Maintenance & Repair | 68 (63.5%) | 39 (36.4%) |
| Total (Category) | 251 (86.6%) | 39 (13.5%) |
| Total (Overall) | 1,329 (53.8%) | 1,143 (46.2%) |
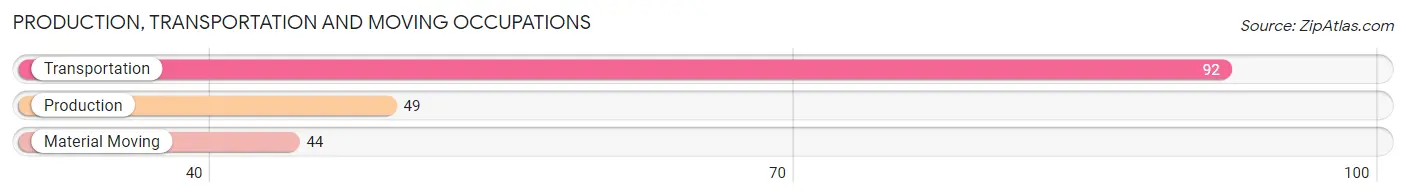
Production, Transportation and Moving Occupations
The most common Production, Transportation and Moving occupations in Heeia are Transportation (92 | 3.7%), Production (49 | 2.0%), and Material Moving (44 | 1.8%).
Production, Transportation and Moving Occupations by Sex
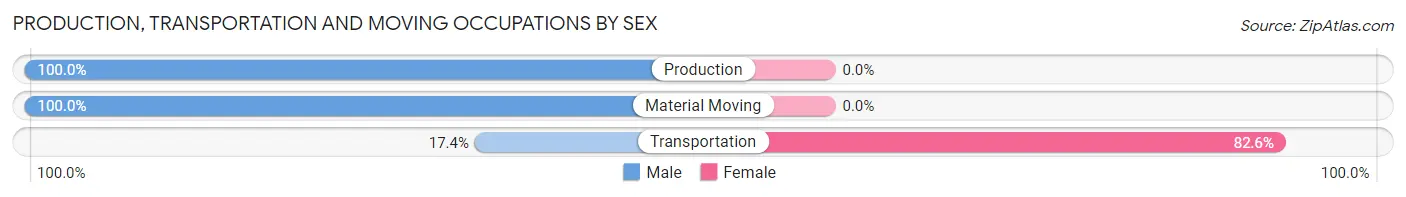
| Occupation | Male | Female |
| Production | 49 (100.0%) | 0 (0.0%) |
| Transportation | 16 (17.4%) | 76 (82.6%) |
| Material Moving | 44 (100.0%) | 0 (0.0%) |
| Total (Category) | 109 (58.9%) | 76 (41.1%) |
| Total (Overall) | 1,329 (53.8%) | 1,143 (46.2%) |
Employment Industries by Sex in Heeia
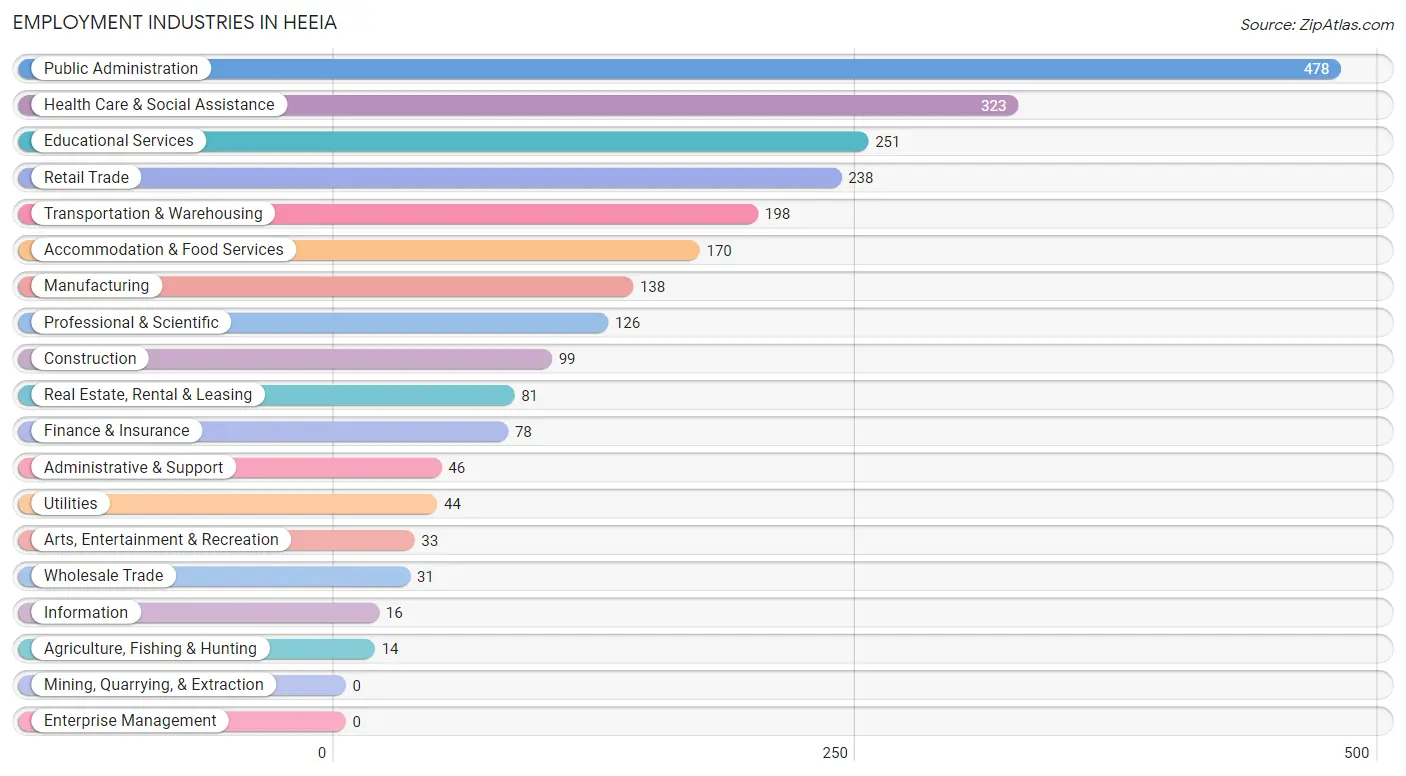
Employment Industries in Heeia
The major employment industries in Heeia include Public Administration (478 | 19.3%), Health Care & Social Assistance (323 | 13.1%), Educational Services (251 | 10.2%), Retail Trade (238 | 9.6%), and Transportation & Warehousing (198 | 8.0%).
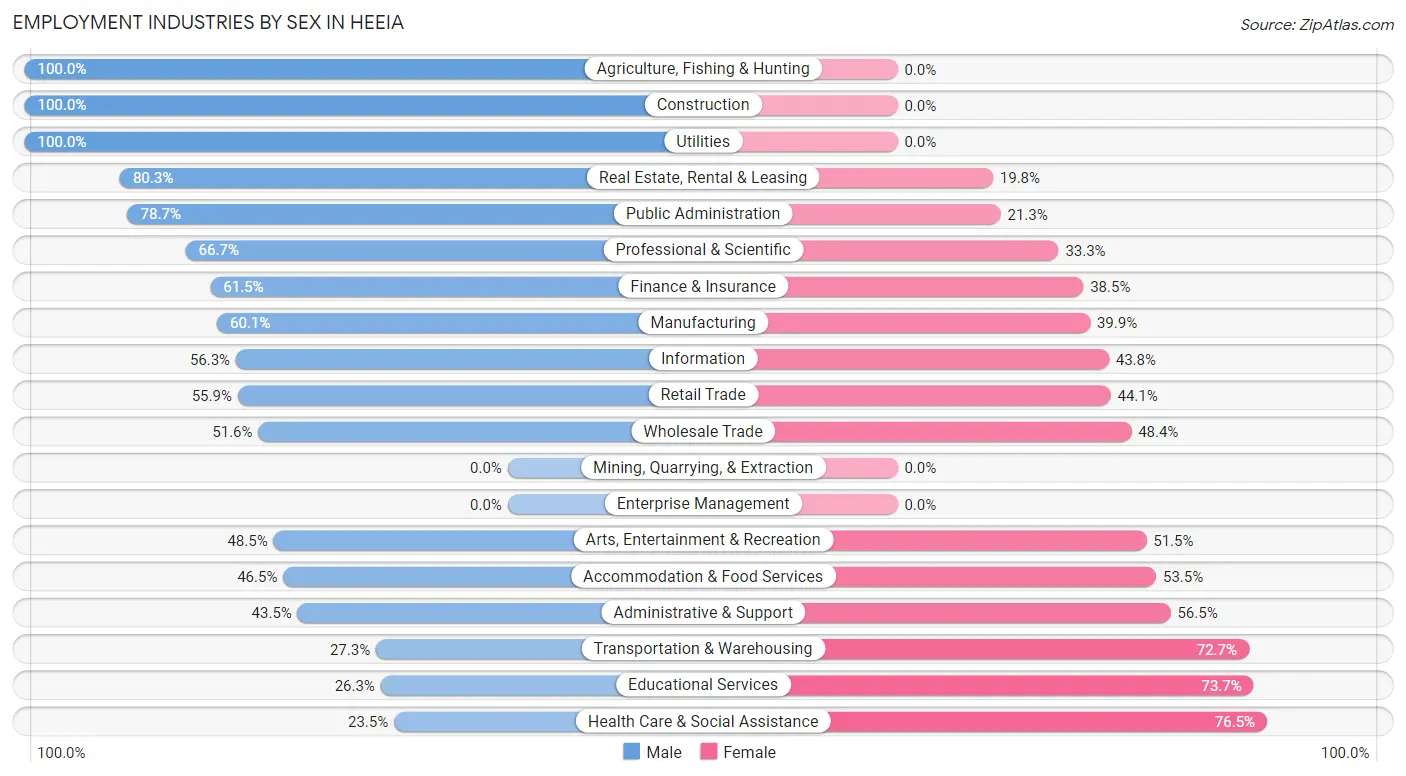
Employment Industries by Sex in Heeia
The Heeia industries that see more men than women are Agriculture, Fishing & Hunting (100.0%), Construction (100.0%), and Utilities (100.0%), whereas the industries that tend to have a higher number of women are Health Care & Social Assistance (76.5%), Educational Services (73.7%), and Transportation & Warehousing (72.7%).
| Industry | Male | Female |
| Agriculture, Fishing & Hunting | 14 (100.0%) | 0 (0.0%) |
| Mining, Quarrying, & Extraction | 0 (0.0%) | 0 (0.0%) |
| Construction | 99 (100.0%) | 0 (0.0%) |
| Manufacturing | 83 (60.1%) | 55 (39.9%) |
| Wholesale Trade | 16 (51.6%) | 15 (48.4%) |
| Retail Trade | 133 (55.9%) | 105 (44.1%) |
| Transportation & Warehousing | 54 (27.3%) | 144 (72.7%) |
| Utilities | 44 (100.0%) | 0 (0.0%) |
| Information | 9 (56.2%) | 7 (43.8%) |
| Finance & Insurance | 48 (61.5%) | 30 (38.5%) |
| Real Estate, Rental & Leasing | 65 (80.2%) | 16 (19.8%) |
| Professional & Scientific | 84 (66.7%) | 42 (33.3%) |
| Enterprise Management | 0 (0.0%) | 0 (0.0%) |
| Administrative & Support | 20 (43.5%) | 26 (56.5%) |
| Educational Services | 66 (26.3%) | 185 (73.7%) |
| Health Care & Social Assistance | 76 (23.5%) | 247 (76.5%) |
| Arts, Entertainment & Recreation | 16 (48.5%) | 17 (51.5%) |
| Accommodation & Food Services | 79 (46.5%) | 91 (53.5%) |
| Public Administration | 376 (78.7%) | 102 (21.3%) |
| Total | 1,329 (53.8%) | 1,143 (46.2%) |
Education in Heeia
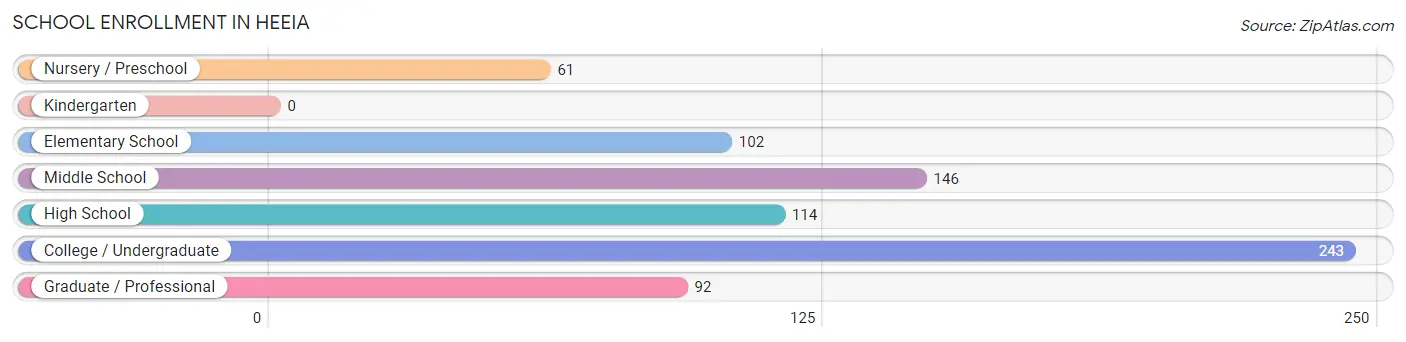
School Enrollment in Heeia
The most common levels of schooling among the 758 students in Heeia are college / undergraduate (243 | 32.1%), middle school (146 | 19.3%), and high school (114 | 15.0%).
| School Level | # Students | % Students |
| Nursery / Preschool | 61 | 8.1% |
| Kindergarten | 0 | 0.0% |
| Elementary School | 102 | 13.5% |
| Middle School | 146 | 19.3% |
| High School | 114 | 15.0% |
| College / Undergraduate | 243 | 32.1% |
| Graduate / Professional | 92 | 12.1% |
| Total | 758 | 100.0% |
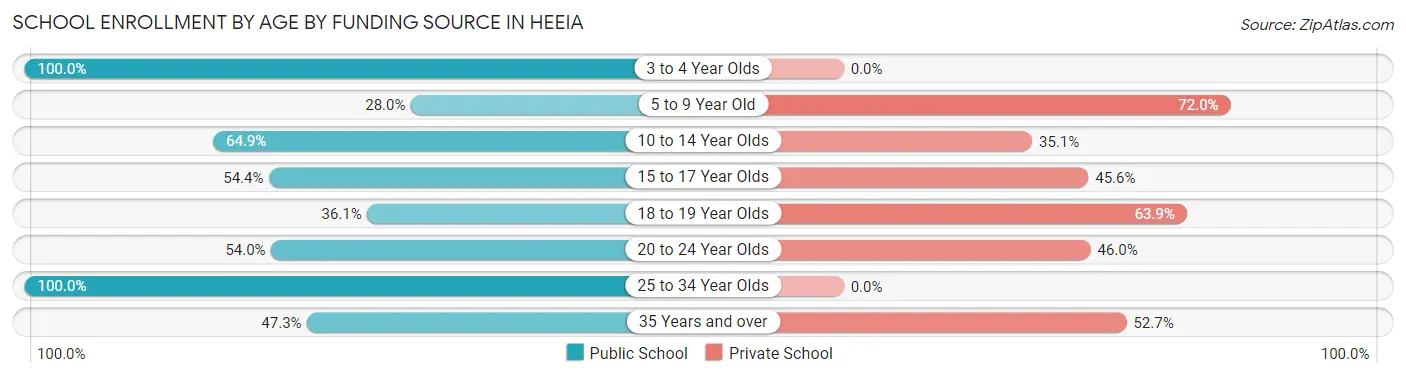
School Enrollment by Age by Funding Source in Heeia
Out of a total of 758 students who are enrolled in schools in Heeia, 316 (41.7%) attend a private institution, while the remaining 442 (58.3%) are enrolled in public schools. The age group of 5 to 9 year old has the highest likelihood of being enrolled in private schools, with 85 (72.0% in the age bracket) enrolled. Conversely, the age group of 3 to 4 year olds has the lowest likelihood of being enrolled in a private school, with 10 (100.0% in the age bracket) attending a public institution.
| Age Bracket | Public School | Private School |
| 3 to 4 Year Olds | 10 (100.0%) | 0 (0.0%) |
| 5 to 9 Year Old | 33 (28.0%) | 85 (72.0%) |
| 10 to 14 Year Olds | 135 (64.9%) | 73 (35.1%) |
| 15 to 17 Year Olds | 43 (54.4%) | 36 (45.6%) |
| 18 to 19 Year Olds | 13 (36.1%) | 23 (63.9%) |
| 20 to 24 Year Olds | 47 (54.0%) | 40 (46.0%) |
| 25 to 34 Year Olds | 108 (100.0%) | 0 (0.0%) |
| 35 Years and over | 53 (47.3%) | 59 (52.7%) |
| Total | 442 (58.3%) | 316 (41.7%) |
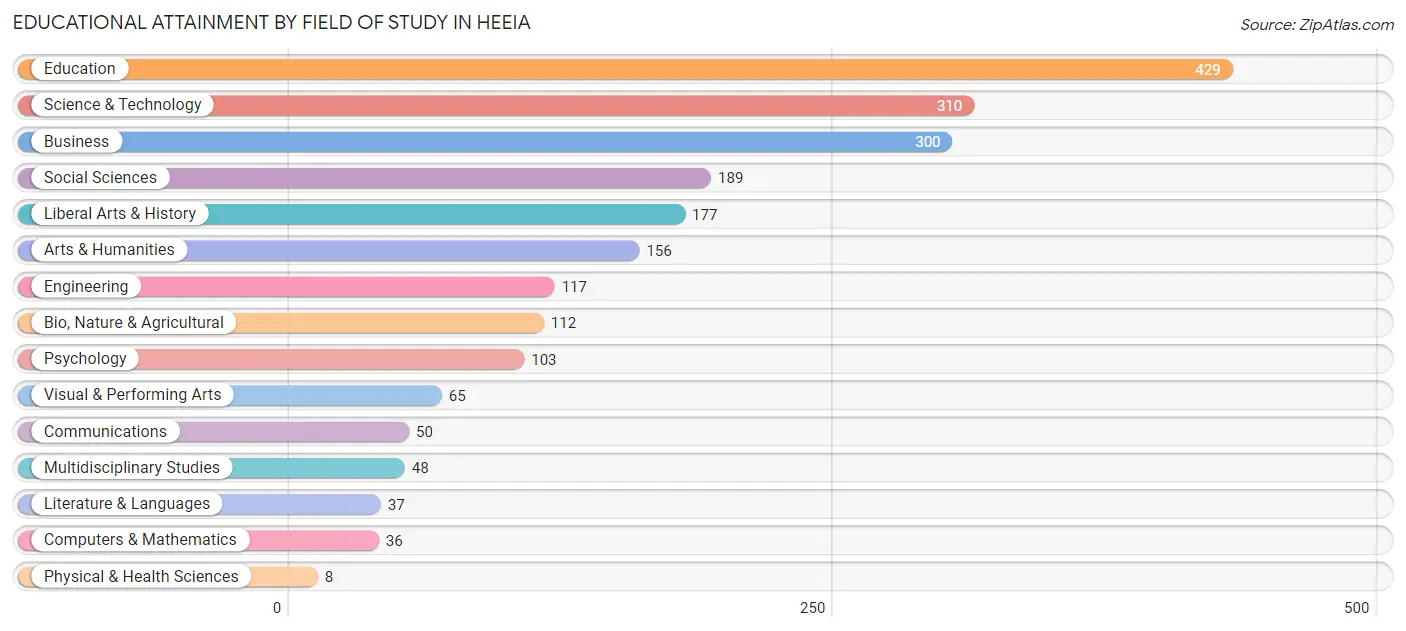
Educational Attainment by Field of Study in Heeia
Education (429 | 20.1%), science & technology (310 | 14.5%), business (300 | 14.0%), social sciences (189 | 8.8%), and liberal arts & history (177 | 8.3%) are the most common fields of study among 2,137 individuals in Heeia who have obtained a bachelor's degree or higher.
| Field of Study | # Graduates | % Graduates |
| Computers & Mathematics | 36 | 1.7% |
| Bio, Nature & Agricultural | 112 | 5.2% |
| Physical & Health Sciences | 8 | 0.4% |
| Psychology | 103 | 4.8% |
| Social Sciences | 189 | 8.8% |
| Engineering | 117 | 5.5% |
| Multidisciplinary Studies | 48 | 2.2% |
| Science & Technology | 310 | 14.5% |
| Business | 300 | 14.0% |
| Education | 429 | 20.1% |
| Literature & Languages | 37 | 1.7% |
| Liberal Arts & History | 177 | 8.3% |
| Visual & Performing Arts | 65 | 3.0% |
| Communications | 50 | 2.3% |
| Arts & Humanities | 156 | 7.3% |
| Total | 2,137 | 100.0% |
Transportation & Commute in Heeia
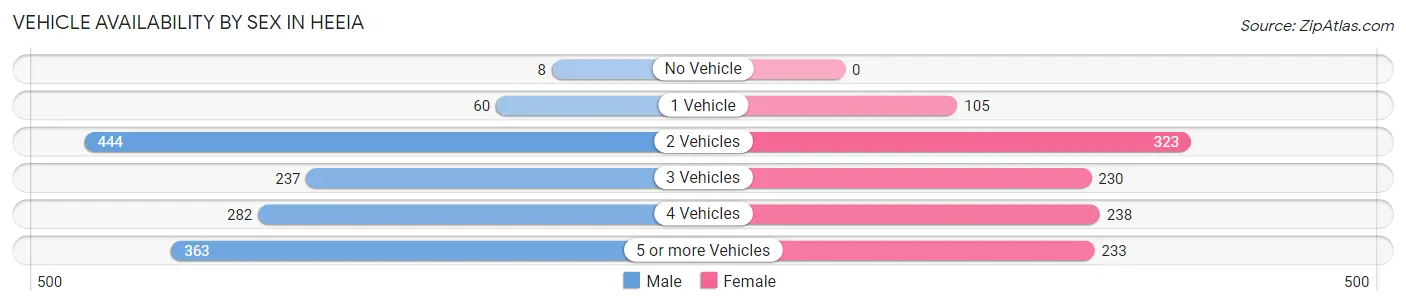
Vehicle Availability by Sex in Heeia
The most prevalent vehicle ownership categories in Heeia are males with 2 vehicles (444, accounting for 31.9%) and females with 2 vehicles (323, making up 39.3%).
| Vehicles Available | Male | Female |
| No Vehicle | 8 (0.6%) | 0 (0.0%) |
| 1 Vehicle | 60 (4.3%) | 105 (9.3%) |
| 2 Vehicles | 444 (31.9%) | 323 (28.6%) |
| 3 Vehicles | 237 (17.0%) | 230 (20.4%) |
| 4 Vehicles | 282 (20.2%) | 238 (21.1%) |
| 5 or more Vehicles | 363 (26.0%) | 233 (20.6%) |
| Total | 1,394 (100.0%) | 1,129 (100.0%) |
Commute Time in Heeia
The most frequently occuring commute durations in Heeia are 30 to 34 minutes (755 commuters, 33.5%), 20 to 24 minutes (402 commuters, 17.8%), and 5 to 9 minutes (204 commuters, 9.0%).
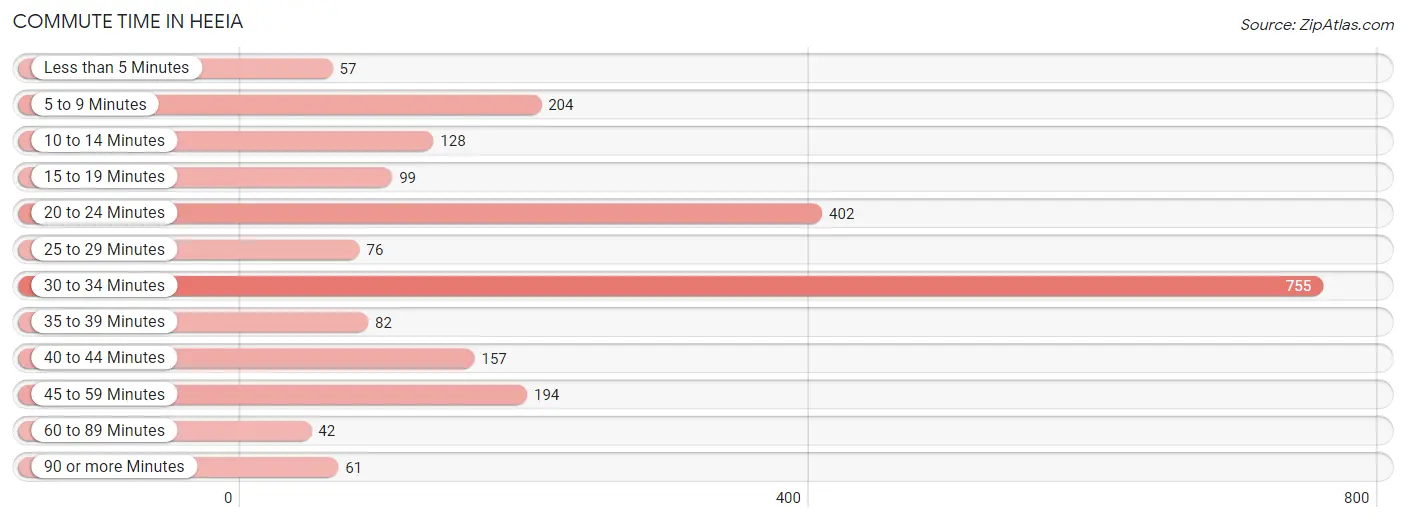
| Commute Time | # Commuters | % Commuters |
| Less than 5 Minutes | 57 | 2.5% |
| 5 to 9 Minutes | 204 | 9.0% |
| 10 to 14 Minutes | 128 | 5.7% |
| 15 to 19 Minutes | 99 | 4.4% |
| 20 to 24 Minutes | 402 | 17.8% |
| 25 to 29 Minutes | 76 | 3.4% |
| 30 to 34 Minutes | 755 | 33.5% |
| 35 to 39 Minutes | 82 | 3.6% |
| 40 to 44 Minutes | 157 | 7.0% |
| 45 to 59 Minutes | 194 | 8.6% |
| 60 to 89 Minutes | 42 | 1.9% |
| 90 or more Minutes | 61 | 2.7% |
Commute Time by Sex in Heeia
The most common commute times in Heeia are 30 to 34 minutes (451 commuters, 37.4%) for males and 30 to 34 minutes (304 commuters, 28.9%) for females.
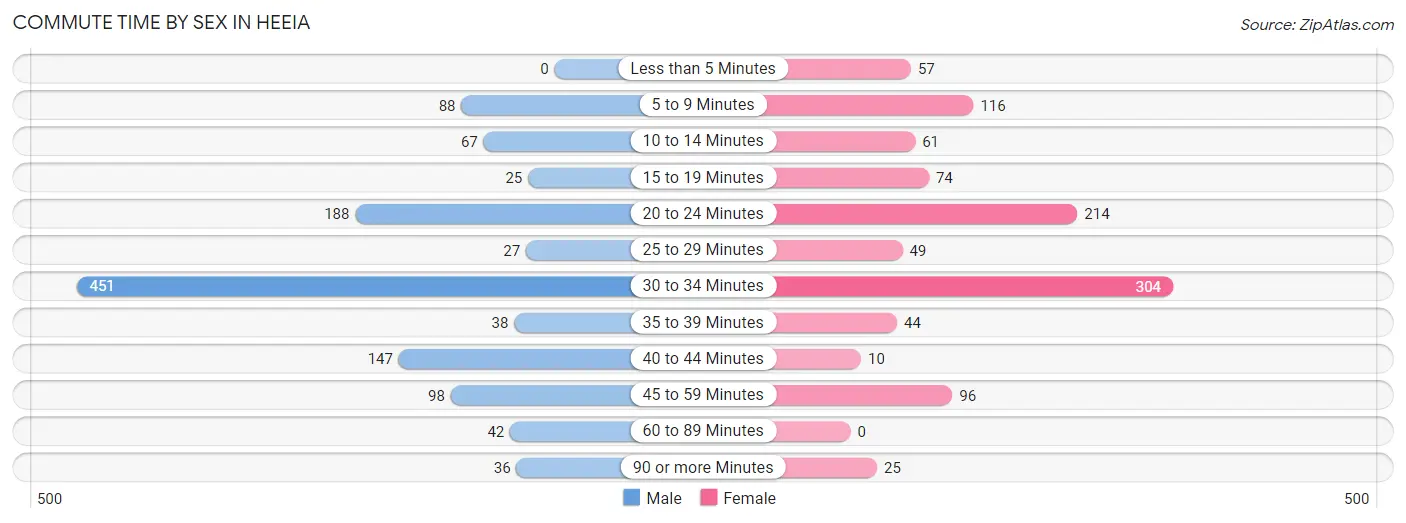
| Commute Time | Male | Female |
| Less than 5 Minutes | 0 (0.0%) | 57 (5.4%) |
| 5 to 9 Minutes | 88 (7.3%) | 116 (11.1%) |
| 10 to 14 Minutes | 67 (5.6%) | 61 (5.8%) |
| 15 to 19 Minutes | 25 (2.1%) | 74 (7.0%) |
| 20 to 24 Minutes | 188 (15.6%) | 214 (20.4%) |
| 25 to 29 Minutes | 27 (2.2%) | 49 (4.7%) |
| 30 to 34 Minutes | 451 (37.4%) | 304 (28.9%) |
| 35 to 39 Minutes | 38 (3.2%) | 44 (4.2%) |
| 40 to 44 Minutes | 147 (12.2%) | 10 (0.9%) |
| 45 to 59 Minutes | 98 (8.1%) | 96 (9.1%) |
| 60 to 89 Minutes | 42 (3.5%) | 0 (0.0%) |
| 90 or more Minutes | 36 (3.0%) | 25 (2.4%) |
Time of Departure to Work by Sex in Heeia
The most frequent times of departure to work in Heeia are 7:00 AM to 7:29 AM (438, 36.3%) for males and 7:00 AM to 7:29 AM (238, 22.7%) for females.
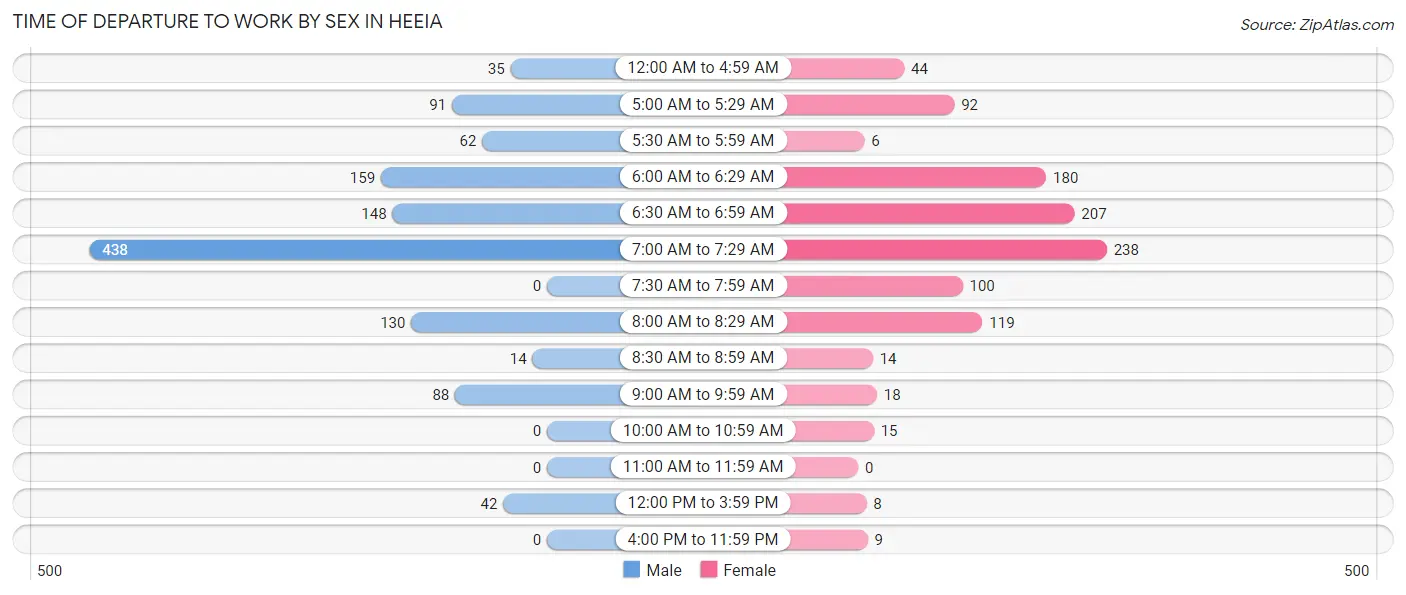
| Time of Departure | Male | Female |
| 12:00 AM to 4:59 AM | 35 (2.9%) | 44 (4.2%) |
| 5:00 AM to 5:29 AM | 91 (7.5%) | 92 (8.8%) |
| 5:30 AM to 5:59 AM | 62 (5.1%) | 6 (0.6%) |
| 6:00 AM to 6:29 AM | 159 (13.2%) | 180 (17.1%) |
| 6:30 AM to 6:59 AM | 148 (12.3%) | 207 (19.7%) |
| 7:00 AM to 7:29 AM | 438 (36.3%) | 238 (22.7%) |
| 7:30 AM to 7:59 AM | 0 (0.0%) | 100 (9.5%) |
| 8:00 AM to 8:29 AM | 130 (10.8%) | 119 (11.3%) |
| 8:30 AM to 8:59 AM | 14 (1.2%) | 14 (1.3%) |
| 9:00 AM to 9:59 AM | 88 (7.3%) | 18 (1.7%) |
| 10:00 AM to 10:59 AM | 0 (0.0%) | 15 (1.4%) |
| 11:00 AM to 11:59 AM | 0 (0.0%) | 0 (0.0%) |
| 12:00 PM to 3:59 PM | 42 (3.5%) | 8 (0.8%) |
| 4:00 PM to 11:59 PM | 0 (0.0%) | 9 (0.9%) |
| Total | 1,207 (100.0%) | 1,050 (100.0%) |
Housing Occupancy in Heeia
Occupancy by Ownership in Heeia
Of the total 1,570 dwellings in Heeia, owner-occupied units account for 1,436 (91.5%), while renter-occupied units make up 134 (8.5%).
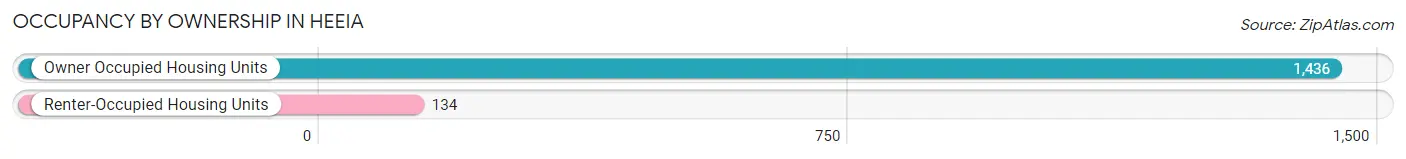
| Occupancy | # Housing Units | % Housing Units |
| Owner Occupied Housing Units | 1,436 | 91.5% |
| Renter-Occupied Housing Units | 134 | 8.5% |
| Total Occupied Housing Units | 1,570 | 100.0% |
Occupancy by Household Size in Heeia
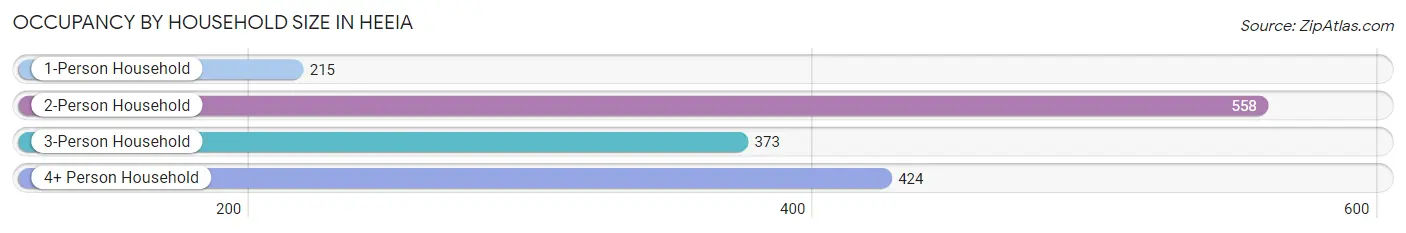
| Household Size | # Housing Units | % Housing Units |
| 1-Person Household | 215 | 13.7% |
| 2-Person Household | 558 | 35.5% |
| 3-Person Household | 373 | 23.8% |
| 4+ Person Household | 424 | 27.0% |
| Total Housing Units | 1,570 | 100.0% |
Occupancy by Ownership by Household Size in Heeia
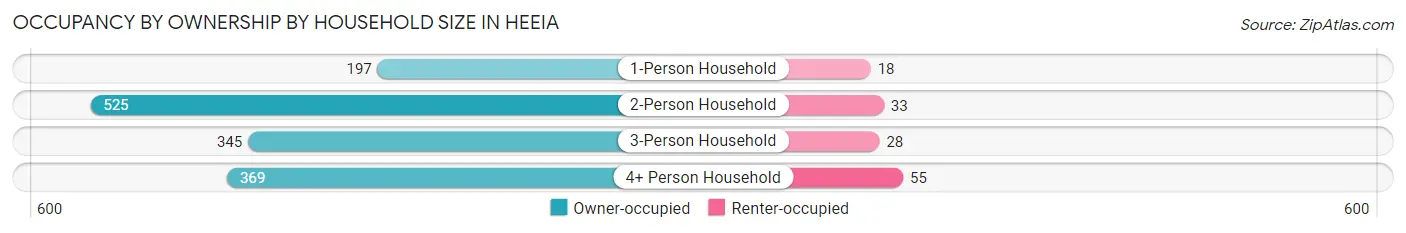
| Household Size | Owner-occupied | Renter-occupied |
| 1-Person Household | 197 (91.6%) | 18 (8.4%) |
| 2-Person Household | 525 (94.1%) | 33 (5.9%) |
| 3-Person Household | 345 (92.5%) | 28 (7.5%) |
| 4+ Person Household | 369 (87.0%) | 55 (13.0%) |
| Total Housing Units | 1,436 (91.5%) | 134 (8.5%) |
Occupancy by Educational Attainment in Heeia
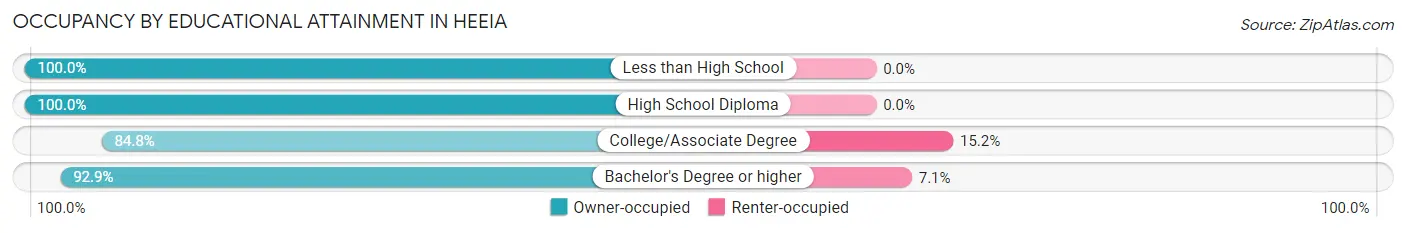
| Household Size | Owner-occupied | Renter-occupied |
| Less than High School | 22 (100.0%) | 0 (0.0%) |
| High School Diploma | 137 (100.0%) | 0 (0.0%) |
| College/Associate Degree | 356 (84.8%) | 64 (15.2%) |
| Bachelor's Degree or higher | 921 (92.9%) | 70 (7.1%) |
Occupancy by Age of Householder in Heeia
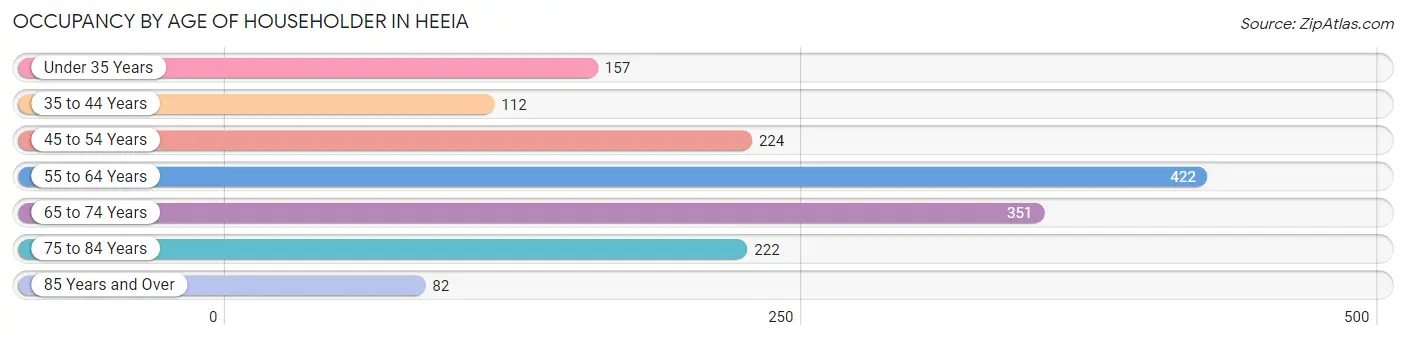
| Age Bracket | # Households | % Households |
| Under 35 Years | 157 | 10.0% |
| 35 to 44 Years | 112 | 7.1% |
| 45 to 54 Years | 224 | 14.3% |
| 55 to 64 Years | 422 | 26.9% |
| 65 to 74 Years | 351 | 22.4% |
| 75 to 84 Years | 222 | 14.1% |
| 85 Years and Over | 82 | 5.2% |
| Total | 1,570 | 100.0% |
Housing Finances in Heeia
Median Income by Occupancy in Heeia
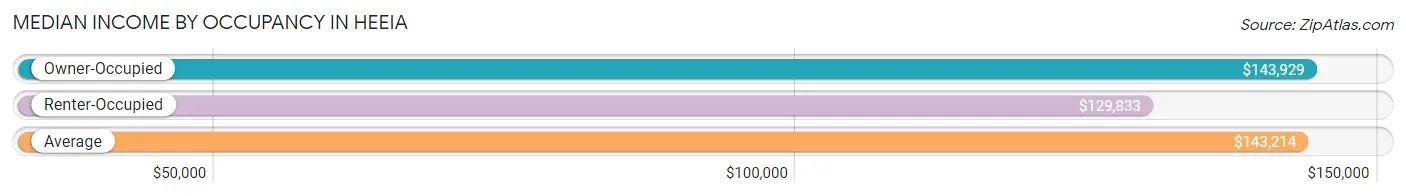
| Occupancy Type | # Households | Median Income |
| Owner-Occupied | 1,436 (91.5%) | $143,929 |
| Renter-Occupied | 134 (8.5%) | $129,833 |
| Average | 1,570 (100.0%) | $143,214 |
Occupancy by Householder Income Bracket in Heeia
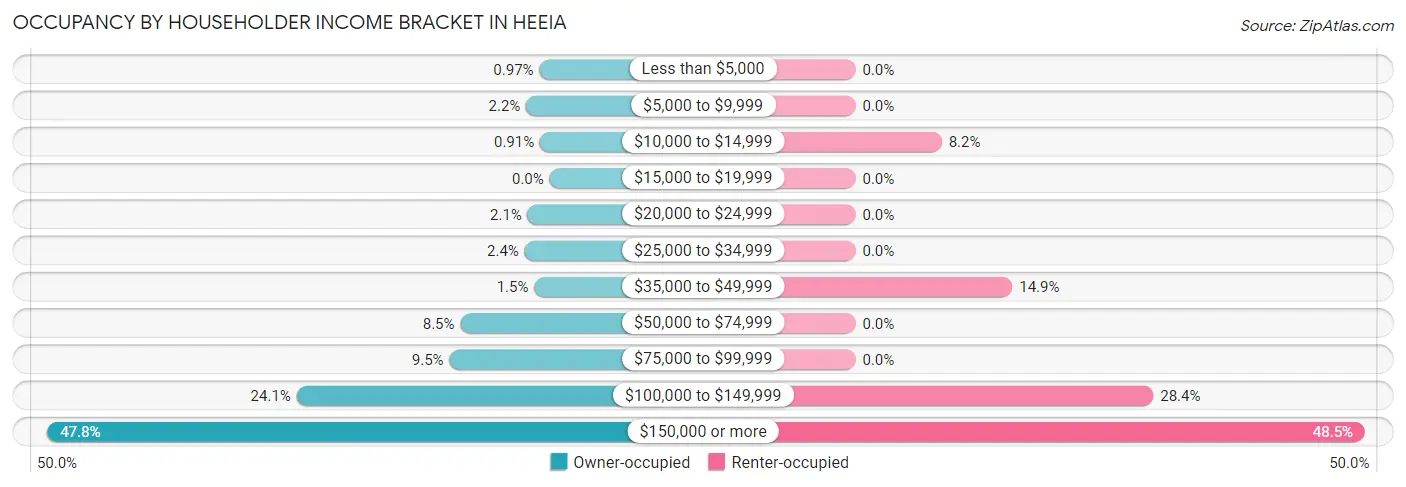
| Income Bracket | Owner-occupied | Renter-occupied |
| Less than $5,000 | 14 (1.0%) | 0 (0.0%) |
| $5,000 to $9,999 | 32 (2.2%) | 0 (0.0%) |
| $10,000 to $14,999 | 13 (0.9%) | 11 (8.2%) |
| $15,000 to $19,999 | 0 (0.0%) | 0 (0.0%) |
| $20,000 to $24,999 | 30 (2.1%) | 0 (0.0%) |
| $25,000 to $34,999 | 34 (2.4%) | 0 (0.0%) |
| $35,000 to $49,999 | 21 (1.5%) | 20 (14.9%) |
| $50,000 to $74,999 | 122 (8.5%) | 0 (0.0%) |
| $75,000 to $99,999 | 137 (9.5%) | 0 (0.0%) |
| $100,000 to $149,999 | 346 (24.1%) | 38 (28.4%) |
| $150,000 or more | 687 (47.8%) | 65 (48.5%) |
| Total | 1,436 (100.0%) | 134 (100.0%) |
Monthly Housing Cost Tiers in Heeia
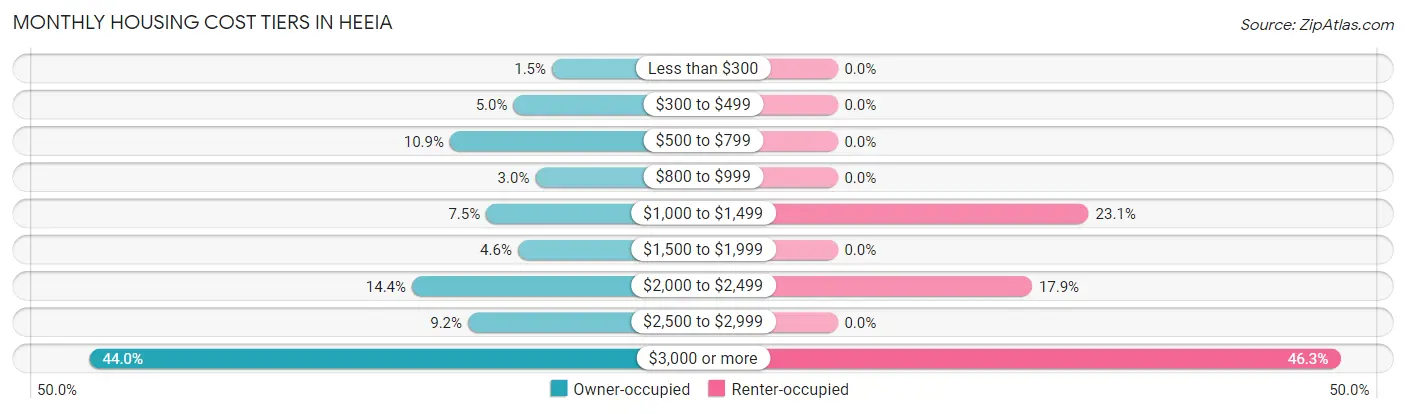
| Monthly Cost | Owner-occupied | Renter-occupied |
| Less than $300 | 21 (1.5%) | 0 (0.0%) |
| $300 to $499 | 72 (5.0%) | 0 (0.0%) |
| $500 to $799 | 156 (10.9%) | 0 (0.0%) |
| $800 to $999 | 43 (3.0%) | 0 (0.0%) |
| $1,000 to $1,499 | 108 (7.5%) | 31 (23.1%) |
| $1,500 to $1,999 | 66 (4.6%) | 0 (0.0%) |
| $2,000 to $2,499 | 206 (14.3%) | 24 (17.9%) |
| $2,500 to $2,999 | 132 (9.2%) | 0 (0.0%) |
| $3,000 or more | 632 (44.0%) | 62 (46.3%) |
| Total | 1,436 (100.0%) | 134 (100.0%) |
Physical Housing Characteristics in Heeia
Housing Structures in Heeia
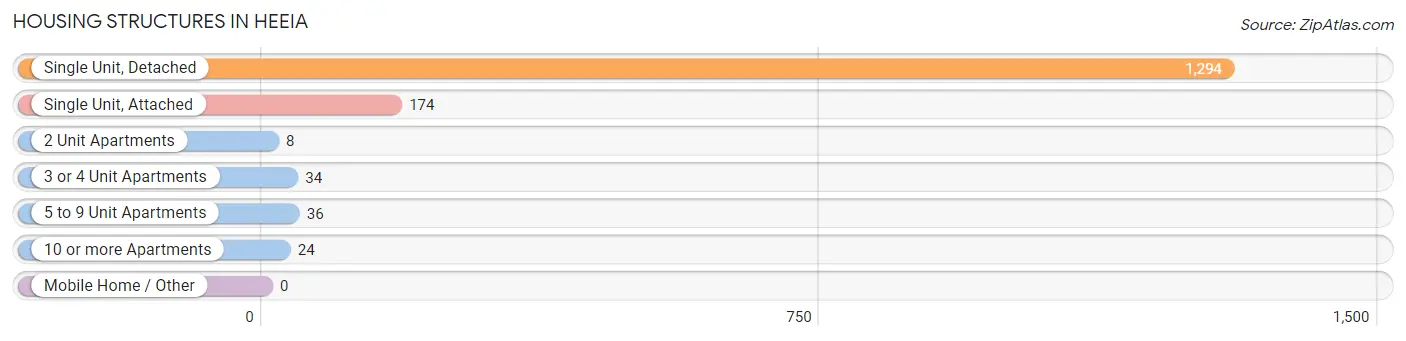
| Structure Type | # Housing Units | % Housing Units |
| Single Unit, Detached | 1,294 | 82.4% |
| Single Unit, Attached | 174 | 11.1% |
| 2 Unit Apartments | 8 | 0.5% |
| 3 or 4 Unit Apartments | 34 | 2.2% |
| 5 to 9 Unit Apartments | 36 | 2.3% |
| 10 or more Apartments | 24 | 1.5% |
| Mobile Home / Other | 0 | 0.0% |
| Total | 1,570 | 100.0% |
Housing Structures by Occupancy in Heeia
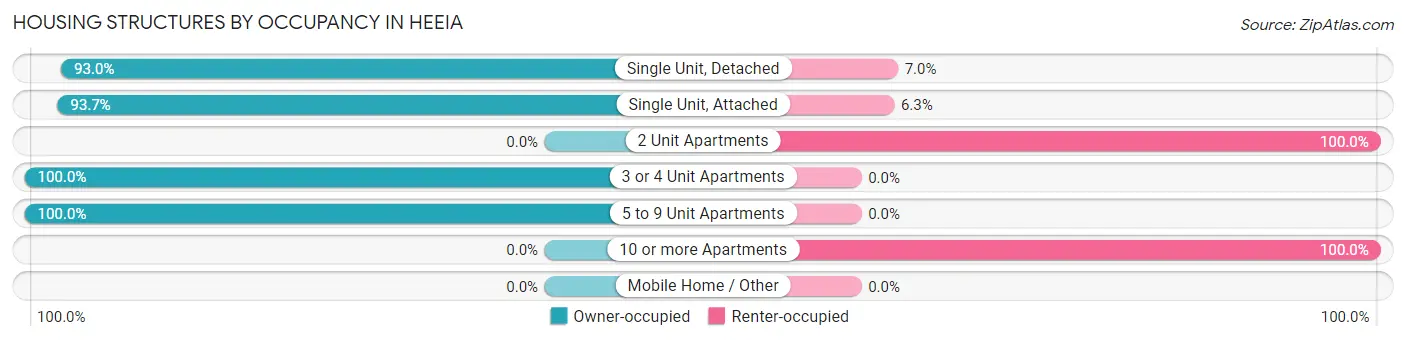
| Structure Type | Owner-occupied | Renter-occupied |
| Single Unit, Detached | 1,203 (93.0%) | 91 (7.0%) |
| Single Unit, Attached | 163 (93.7%) | 11 (6.3%) |
| 2 Unit Apartments | 0 (0.0%) | 8 (100.0%) |
| 3 or 4 Unit Apartments | 34 (100.0%) | 0 (0.0%) |
| 5 to 9 Unit Apartments | 36 (100.0%) | 0 (0.0%) |
| 10 or more Apartments | 0 (0.0%) | 24 (100.0%) |
| Mobile Home / Other | 0 (0.0%) | 0 (0.0%) |
| Total | 1,436 (91.5%) | 134 (8.5%) |
Housing Structures by Number of Rooms in Heeia
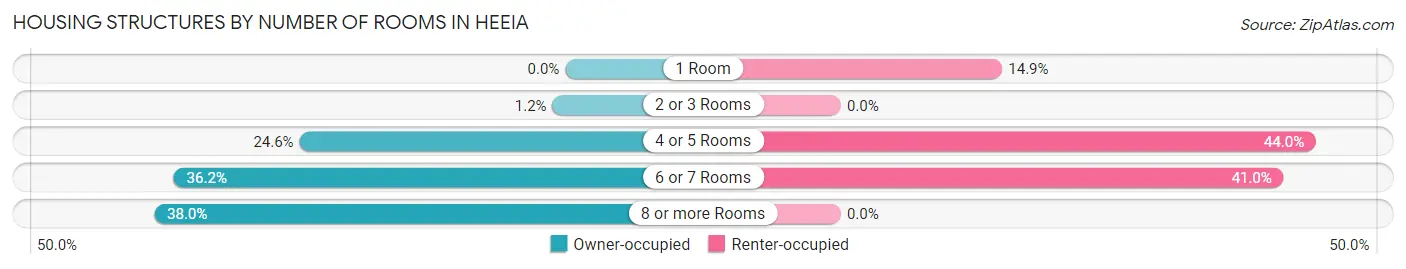
| Number of Rooms | Owner-occupied | Renter-occupied |
| 1 Room | 0 (0.0%) | 20 (14.9%) |
| 2 or 3 Rooms | 17 (1.2%) | 0 (0.0%) |
| 4 or 5 Rooms | 353 (24.6%) | 59 (44.0%) |
| 6 or 7 Rooms | 520 (36.2%) | 55 (41.0%) |
| 8 or more Rooms | 546 (38.0%) | 0 (0.0%) |
| Total | 1,436 (100.0%) | 134 (100.0%) |
Housing Structure by Heating Type in Heeia
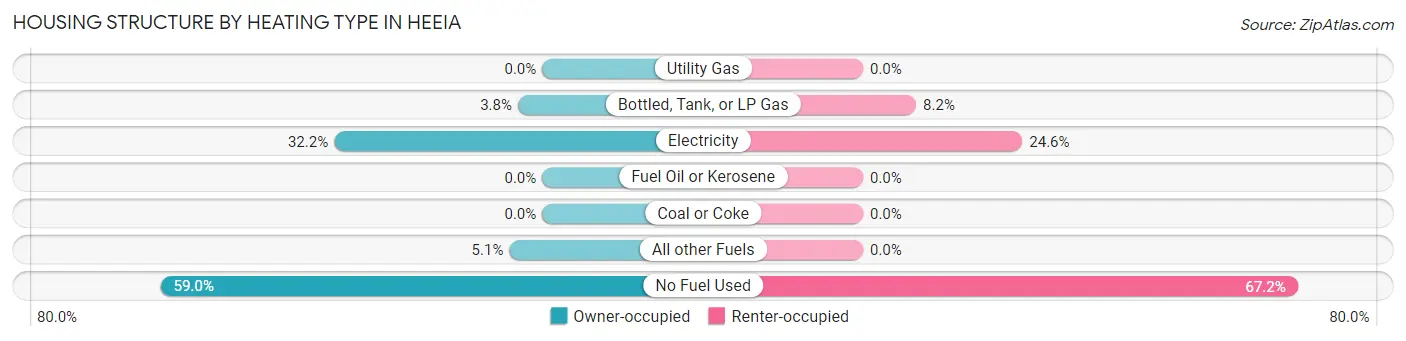
| Heating Type | Owner-occupied | Renter-occupied |
| Utility Gas | 0 (0.0%) | 0 (0.0%) |
| Bottled, Tank, or LP Gas | 54 (3.8%) | 11 (8.2%) |
| Electricity | 462 (32.2%) | 33 (24.6%) |
| Fuel Oil or Kerosene | 0 (0.0%) | 0 (0.0%) |
| Coal or Coke | 0 (0.0%) | 0 (0.0%) |
| All other Fuels | 73 (5.1%) | 0 (0.0%) |
| No Fuel Used | 847 (59.0%) | 90 (67.2%) |
| Total | 1,436 (100.0%) | 134 (100.0%) |
Household Vehicle Usage in Heeia
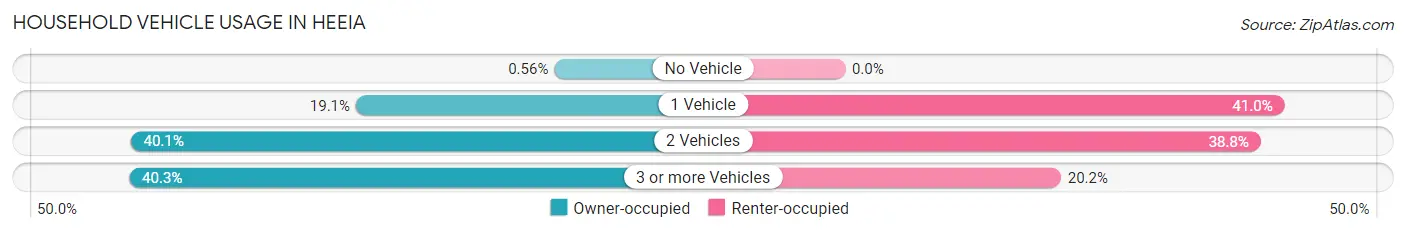
| Vehicles per Household | Owner-occupied | Renter-occupied |
| No Vehicle | 8 (0.6%) | 0 (0.0%) |
| 1 Vehicle | 274 (19.1%) | 55 (41.0%) |
| 2 Vehicles | 576 (40.1%) | 52 (38.8%) |
| 3 or more Vehicles | 578 (40.3%) | 27 (20.2%) |
| Total | 1,436 (100.0%) | 134 (100.0%) |
Real Estate & Mortgages in Heeia
Real Estate and Mortgage Overview in Heeia
| Characteristic | Without Mortgage | With Mortgage |
| Housing Units | 350 | 1,086 |
| Median Property Value | $1,122,600 | $1,126,800 |
| Median Household Income | $118,000 | $572 |
| Monthly Housing Costs | $650 | $632 |
| Real Estate Taxes | $3,301 | $31 |
Property Value by Mortgage Status in Heeia
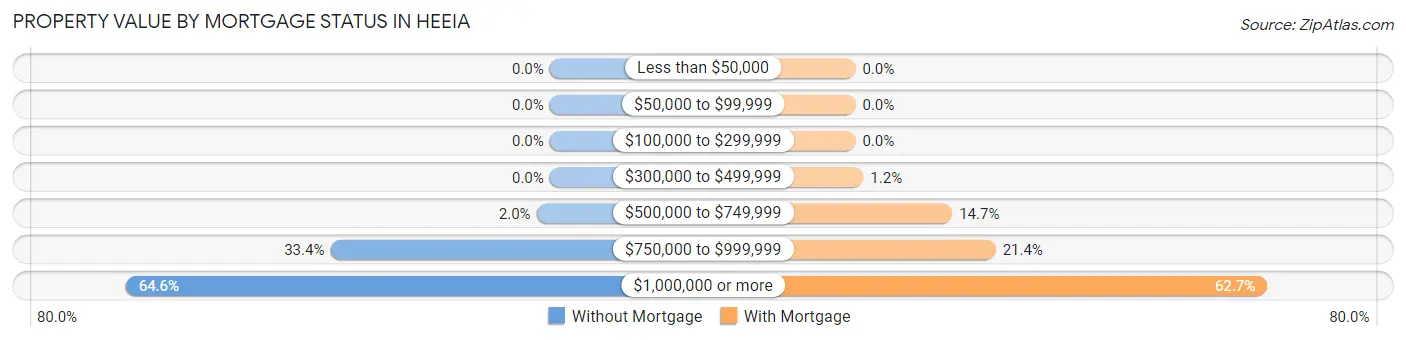
| Property Value | Without Mortgage | With Mortgage |
| Less than $50,000 | 0 (0.0%) | 0 (0.0%) |
| $50,000 to $99,999 | 0 (0.0%) | 0 (0.0%) |
| $100,000 to $299,999 | 0 (0.0%) | 0 (0.0%) |
| $300,000 to $499,999 | 0 (0.0%) | 13 (1.2%) |
| $500,000 to $749,999 | 7 (2.0%) | 160 (14.7%) |
| $750,000 to $999,999 | 117 (33.4%) | 232 (21.4%) |
| $1,000,000 or more | 226 (64.6%) | 681 (62.7%) |
| Total | 350 (100.0%) | 1,086 (100.0%) |
Household Income by Mortgage Status in Heeia
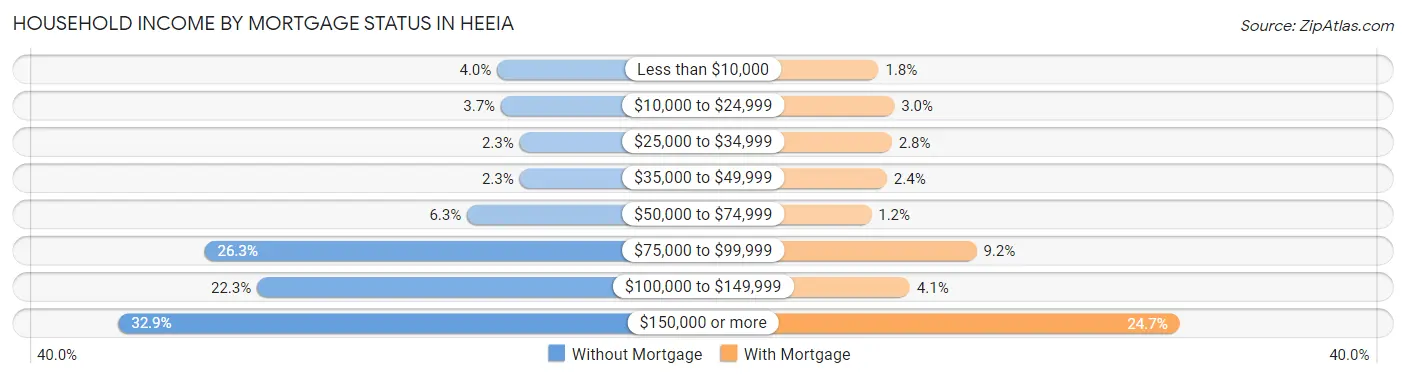
| Household Income | Without Mortgage | With Mortgage |
| Less than $10,000 | 14 (4.0%) | 19 (1.8%) |
| $10,000 to $24,999 | 13 (3.7%) | 32 (2.9%) |
| $25,000 to $34,999 | 8 (2.3%) | 30 (2.8%) |
| $35,000 to $49,999 | 8 (2.3%) | 26 (2.4%) |
| $50,000 to $74,999 | 22 (6.3%) | 13 (1.2%) |
| $75,000 to $99,999 | 92 (26.3%) | 100 (9.2%) |
| $100,000 to $149,999 | 78 (22.3%) | 45 (4.1%) |
| $150,000 or more | 115 (32.9%) | 268 (24.7%) |
| Total | 350 (100.0%) | 1,086 (100.0%) |
Property Value to Household Income Ratio in Heeia
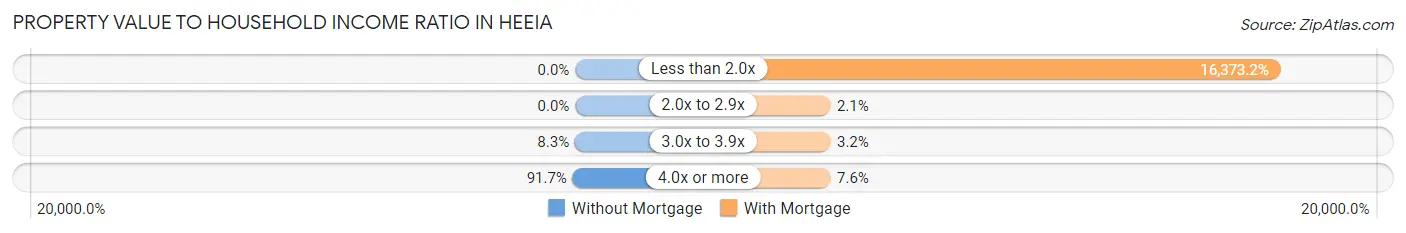
| Value-to-Income Ratio | Without Mortgage | With Mortgage |
| Less than 2.0x | 0 (0.0%) | 177,813 (16,373.2%) |
| 2.0x to 2.9x | 0 (0.0%) | 23 (2.1%) |
| 3.0x to 3.9x | 29 (8.3%) | 35 (3.2%) |
| 4.0x or more | 321 (91.7%) | 83 (7.6%) |
| Total | 350 (100.0%) | 1,086 (100.0%) |
Real Estate Taxes by Mortgage Status in Heeia
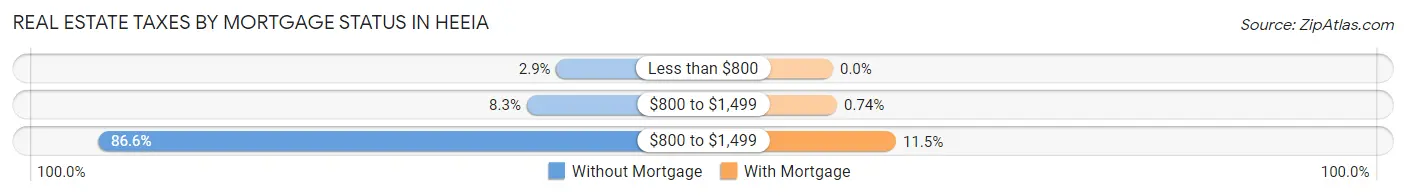
| Property Taxes | Without Mortgage | With Mortgage |
| Less than $800 | 10 (2.9%) | 0 (0.0%) |
| $800 to $1,499 | 29 (8.3%) | 8 (0.7%) |
| $800 to $1,499 | 303 (86.6%) | 125 (11.5%) |
| Total | 350 (100.0%) | 1,086 (100.0%) |
Health & Disability in Heeia
Health Insurance Coverage by Age in Heeia
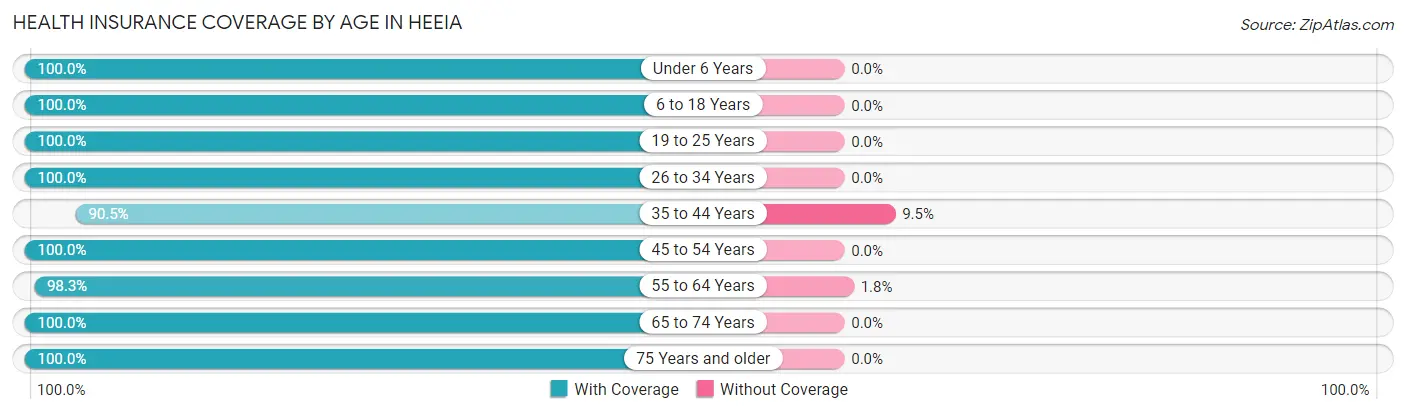
| Age Bracket | With Coverage | Without Coverage |
| Under 6 Years | 378 (100.0%) | 0 (0.0%) |
| 6 to 18 Years | 379 (100.0%) | 0 (0.0%) |
| 19 to 25 Years | 172 (100.0%) | 0 (0.0%) |
| 26 to 34 Years | 639 (100.0%) | 0 (0.0%) |
| 35 to 44 Years | 448 (90.5%) | 47 (9.5%) |
| 45 to 54 Years | 490 (100.0%) | 0 (0.0%) |
| 55 to 64 Years | 897 (98.3%) | 16 (1.8%) |
| 65 to 74 Years | 647 (100.0%) | 0 (0.0%) |
| 75 Years and older | 560 (100.0%) | 0 (0.0%) |
| Total | 4,610 (98.7%) | 63 (1.3%) |
Health Insurance Coverage by Citizenship Status in Heeia
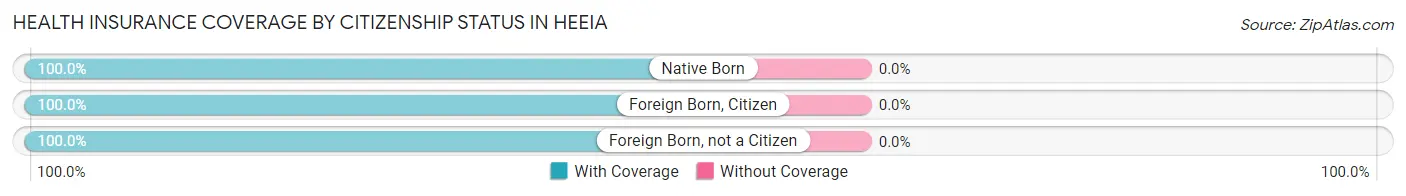
| Citizenship Status | With Coverage | Without Coverage |
| Native Born | 378 (100.0%) | 0 (0.0%) |
| Foreign Born, Citizen | 379 (100.0%) | 0 (0.0%) |
| Foreign Born, not a Citizen | 172 (100.0%) | 0 (0.0%) |
Health Insurance Coverage by Household Income in Heeia
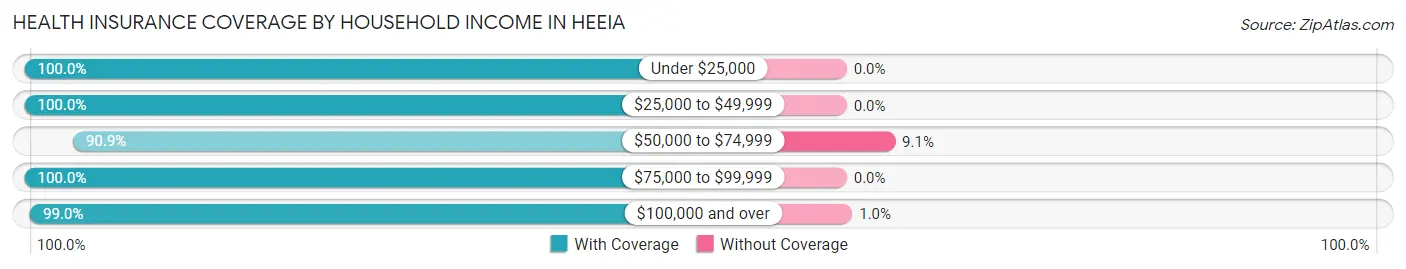
| Household Income | With Coverage | Without Coverage |
| Under $25,000 | 160 (100.0%) | 0 (0.0%) |
| $25,000 to $49,999 | 177 (100.0%) | 0 (0.0%) |
| $50,000 to $74,999 | 241 (90.9%) | 24 (9.1%) |
| $75,000 to $99,999 | 277 (100.0%) | 0 (0.0%) |
| $100,000 and over | 3,743 (99.0%) | 39 (1.0%) |
Public vs Private Health Insurance Coverage by Age in Heeia
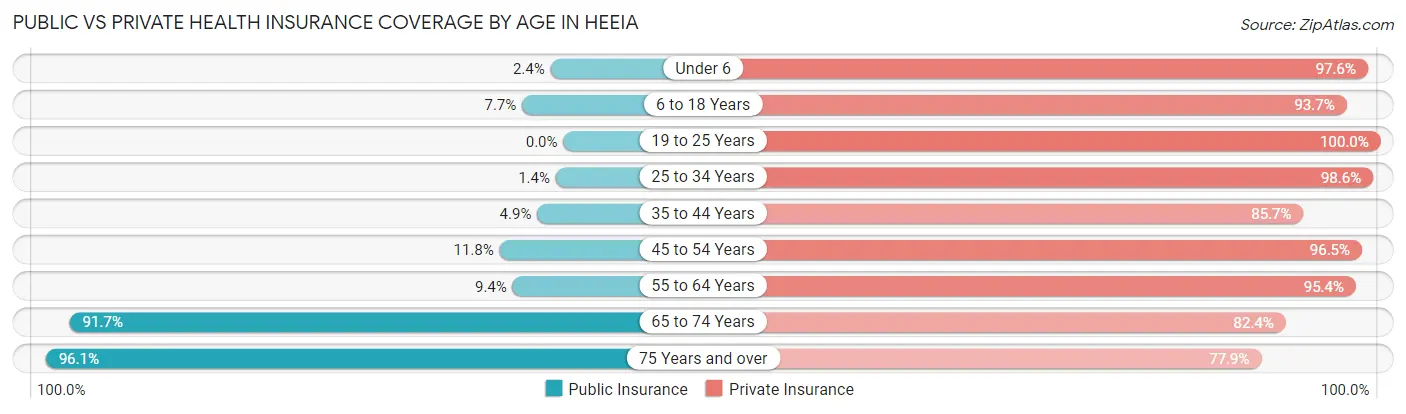
| Age Bracket | Public Insurance | Private Insurance |
| Under 6 | 9 (2.4%) | 369 (97.6%) |
| 6 to 18 Years | 29 (7.6%) | 355 (93.7%) |
| 19 to 25 Years | 0 (0.0%) | 172 (100.0%) |
| 25 to 34 Years | 9 (1.4%) | 630 (98.6%) |
| 35 to 44 Years | 24 (4.9%) | 424 (85.7%) |
| 45 to 54 Years | 58 (11.8%) | 473 (96.5%) |
| 55 to 64 Years | 86 (9.4%) | 871 (95.4%) |
| 65 to 74 Years | 593 (91.6%) | 533 (82.4%) |
| 75 Years and over | 538 (96.1%) | 436 (77.9%) |
| Total | 1,346 (28.8%) | 4,263 (91.2%) |
Disability Status by Sex by Age in Heeia
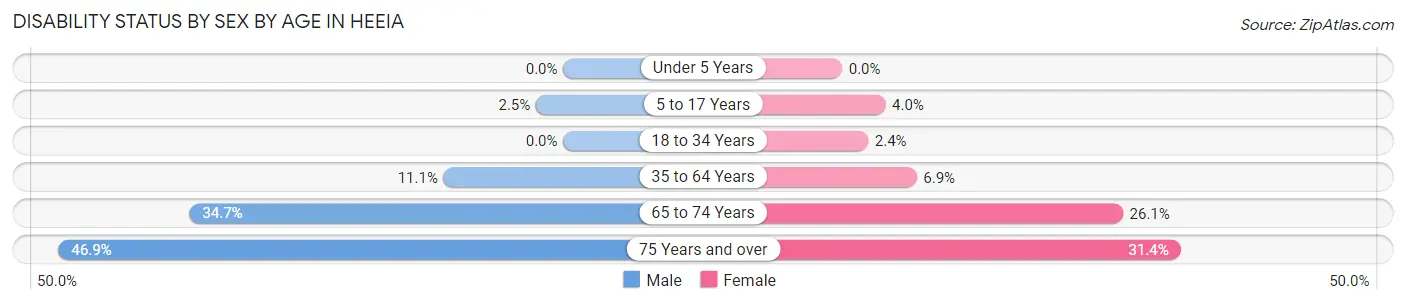
| Age Bracket | Male | Female |
| Under 5 Years | 0 (0.0%) | 0 (0.0%) |
| 5 to 17 Years | 5 (2.5%) | 9 (4.0%) |
| 18 to 34 Years | 0 (0.0%) | 10 (2.4%) |
| 35 to 64 Years | 108 (11.1%) | 64 (6.9%) |
| 65 to 74 Years | 110 (34.7%) | 86 (26.1%) |
| 75 Years and over | 97 (46.9%) | 111 (31.4%) |
Disability Class by Sex by Age in Heeia
Disability Class: Hearing Difficulty
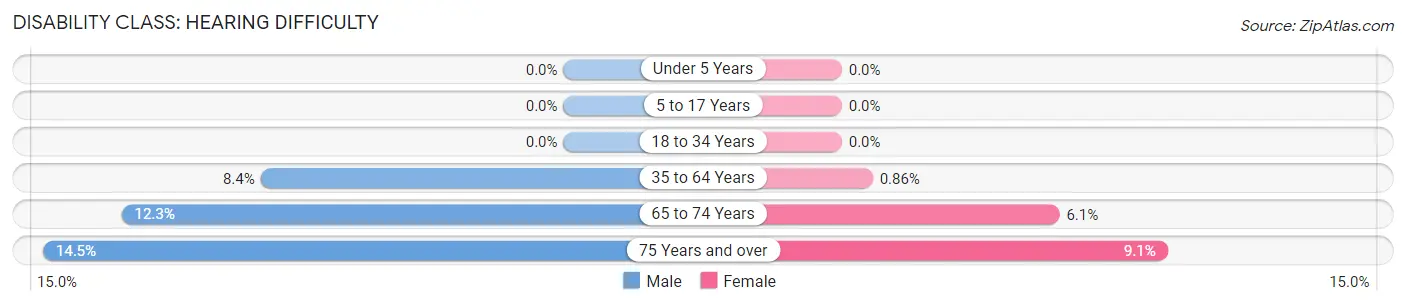
| Age Bracket | Male | Female |
| Under 5 Years | 0 (0.0%) | 0 (0.0%) |
| 5 to 17 Years | 0 (0.0%) | 0 (0.0%) |
| 18 to 34 Years | 0 (0.0%) | 0 (0.0%) |
| 35 to 64 Years | 82 (8.4%) | 8 (0.9%) |
| 65 to 74 Years | 39 (12.3%) | 20 (6.1%) |
| 75 Years and over | 30 (14.5%) | 32 (9.1%) |
Disability Class: Vision Difficulty
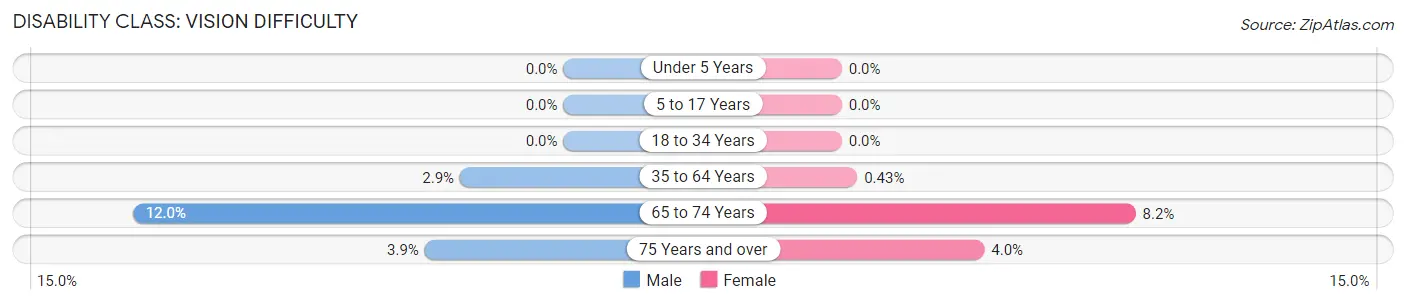
| Age Bracket | Male | Female |
| Under 5 Years | 0 (0.0%) | 0 (0.0%) |
| 5 to 17 Years | 0 (0.0%) | 0 (0.0%) |
| 18 to 34 Years | 0 (0.0%) | 0 (0.0%) |
| 35 to 64 Years | 28 (2.9%) | 4 (0.4%) |
| 65 to 74 Years | 38 (12.0%) | 27 (8.2%) |
| 75 Years and over | 8 (3.9%) | 14 (4.0%) |
Disability Class: Cognitive Difficulty
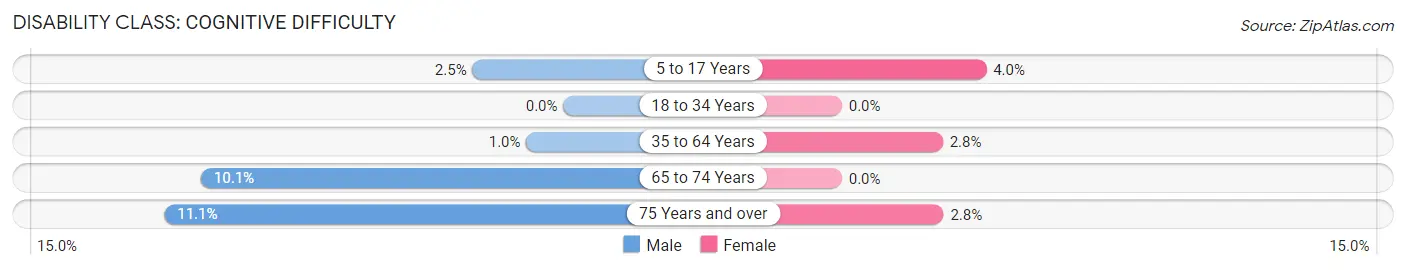
| Age Bracket | Male | Female |
| 5 to 17 Years | 5 (2.5%) | 9 (4.0%) |
| 18 to 34 Years | 0 (0.0%) | 0 (0.0%) |
| 35 to 64 Years | 10 (1.0%) | 26 (2.8%) |
| 65 to 74 Years | 32 (10.1%) | 0 (0.0%) |
| 75 Years and over | 23 (11.1%) | 10 (2.8%) |
Disability Class: Ambulatory Difficulty
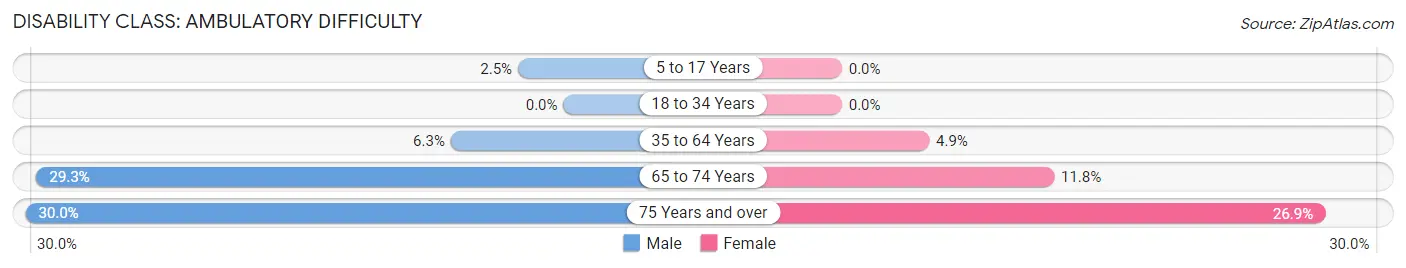
| Age Bracket | Male | Female |
| 5 to 17 Years | 5 (2.5%) | 0 (0.0%) |
| 18 to 34 Years | 0 (0.0%) | 0 (0.0%) |
| 35 to 64 Years | 61 (6.3%) | 45 (4.9%) |
| 65 to 74 Years | 93 (29.3%) | 39 (11.8%) |
| 75 Years and over | 62 (29.9%) | 95 (26.9%) |
Disability Class: Self-Care Difficulty
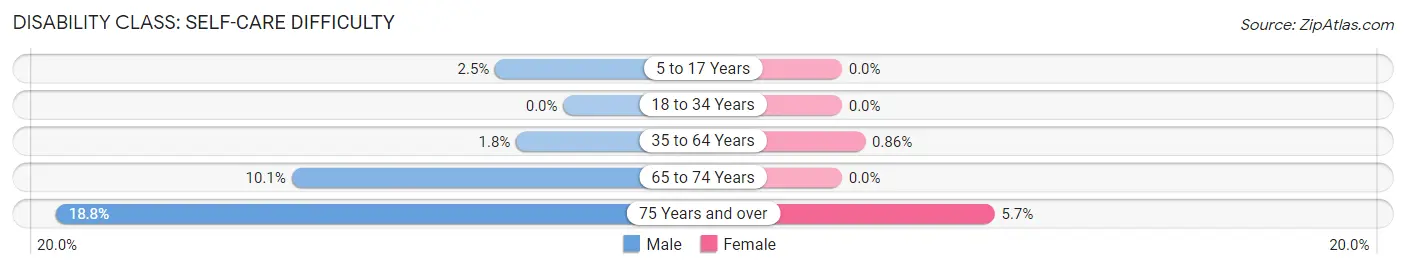
| Age Bracket | Male | Female |
| 5 to 17 Years | 5 (2.5%) | 0 (0.0%) |
| 18 to 34 Years | 0 (0.0%) | 0 (0.0%) |
| 35 to 64 Years | 17 (1.8%) | 8 (0.9%) |
| 65 to 74 Years | 32 (10.1%) | 0 (0.0%) |
| 75 Years and over | 39 (18.8%) | 20 (5.7%) |
Technology Access in Heeia
Computing Device Access in Heeia
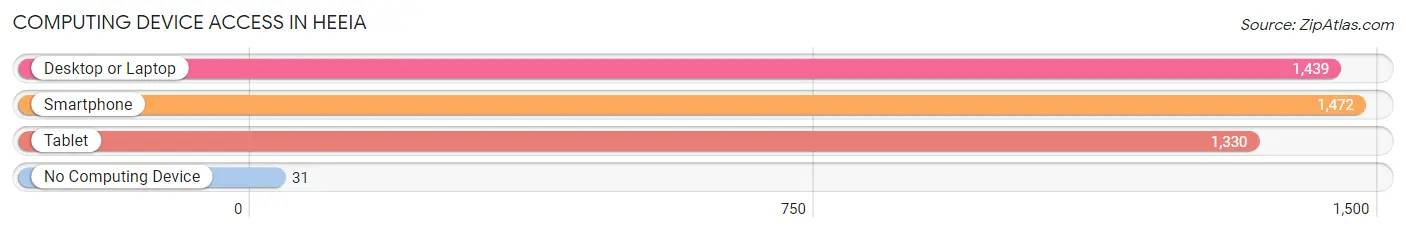
| Device Type | # Households | % Households |
| Desktop or Laptop | 1,439 | 91.7% |
| Smartphone | 1,472 | 93.8% |
| Tablet | 1,330 | 84.7% |
| No Computing Device | 31 | 2.0% |
| Total | 1,570 | 100.0% |
Internet Access in Heeia
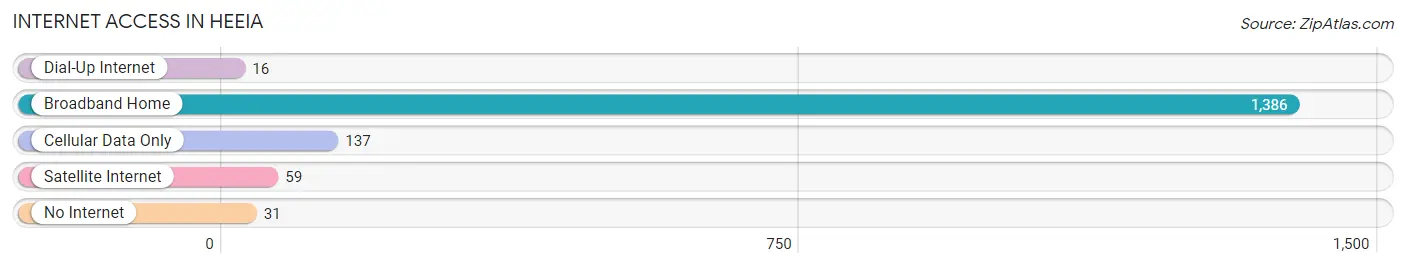
| Internet Type | # Households | % Households |
| Dial-Up Internet | 16 | 1.0% |
| Broadband Home | 1,386 | 88.3% |
| Cellular Data Only | 137 | 8.7% |
| Satellite Internet | 59 | 3.8% |
| No Internet | 31 | 2.0% |
| Total | 1,570 | 100.0% |
Heeia Summary
Heeia is a small community located in the ahupuaʻa of Heeia in the Koʻolaupoko District of the island of Oʻahu in the Hawaiian Islands. It is located on the windward side of the island, just north of Kaneohe and south of Kahaluʻu. Heeia is a rural community with a population of approximately 2,000 people.
History
Heeia has a long and rich history that dates back to the early days of Hawaiian settlement. The ahupuaʻa of Heeia was one of the first areas to be settled by the ancient Hawaiians. It was an important area for fishing, farming, and gathering resources. The ahupuaʻa was divided into several moku, or districts, and each moku was ruled by a chief.
In the late 1700s, Heeia was part of the Kingdom of Hawaiʻi and was ruled by King Kamehameha I. During this time, the ahupuaʻa was divided into several ahupuaʻa, each of which was ruled by a chief.
In the early 1800s, Heeia was part of the Kingdom of Hawaiʻi and was ruled by King Kamehameha II. During this time, the ahupuaʻa was divided into several ahupuaʻa, each of which was ruled by a chief.
In the late 1800s, Heeia was part of the Republic of Hawaiʻi and was ruled by President Sanford B. Dole. During this time, the ahupuaʻa was divided into several ahupuaʻa, each of which was ruled by a chief.
In the early 1900s, Heeia was part of the Territory of Hawaiʻi and was ruled by Governor Walter F. Frear. During this time, the ahupuaʻa was divided into several ahupuaʻa, each of which was ruled by a chief.
In the late 1900s, Heeia was part of the State of Hawaiʻi and was ruled by Governor John A. Burns. During this time, the ahupuaʻa was divided into several ahupuaʻa, each of which was ruled by a chief.
Geography
Heeia is located on the windward side of the island of Oʻahu in the Koʻolaupoko District. It is bordered by the ahupuaʻa of Kaneohe to the south, Kahaluʻu to the north, and Kailua to the east. Heeia is located at an elevation of approximately 500 feet above sea level.
The ahupuaʻa of Heeia is made up of several valleys and ridges. The valleys are home to several streams, including the Heeia Stream, which flows from the Koʻolau Mountains to the sea. The ridges are home to several peaks, including the Puʻu O Kona peak, which is the highest point in the ahupuaʻa.
Economy
Heeia is a rural community with a population of approximately 2,000 people. The economy of Heeia is largely based on agriculture and fishing. The ahupuaʻa is home to several farms, which produce a variety of fruits and vegetables, including papayas, bananas, and taro. The Heeia Stream is also home to several fishponds, which are used to raise a variety of fish, including mullet, milkfish, and tilapia.
In addition to agriculture and fishing, Heeia is also home to several small businesses, including restaurants, shops, and art galleries. The Heeia Kea Marina is also located in the ahupuaʻa, and it is home to several charter fishing boats and recreational boats.
Demographics
As of the 2010 census, the population of Heeia was 2,000 people. The racial makeup of the ahupuaʻa was 57.2% White, 22.2% Native Hawaiian or Pacific Islander, 15.2% Asian, and 5.4% other races. The median household income was $60,000, and the median age was 40 years.
Conclusion
Heeia is a small rural community located on the windward side of the island of Oʻahu in the Koʻolaupoko District. It has a long and rich history that dates back to the early days of Hawaiian settlement. The economy of Heeia is largely based on agriculture and fishing, and the ahupuaʻa is home to several small businesses. The population of Heeia is approximately 2,000 people, and the racial makeup is 57.2% White, 22.2% Native Hawaiian or Pacific Islander, 15.2% Asian, and 5.4% other races.
Common Questions
What is the Total Population of Heeia?
Total Population of Heeia is 4,786.
What is the Total Male Population of Heeia?
Total Male Population of Heeia is 2,347.
What is the Total Female Population of Heeia?
Total Female Population of Heeia is 2,439.
What is the Ratio of Males per 100 Females in Heeia?
There are 96.23 Males per 100 Females in Heeia.
What is the Ratio of Females per 100 Males in Heeia?
There are 103.92 Females per 100 Males in Heeia.
What is the Median Population Age in Heeia?
Median Population Age in Heeia is 51.4 Years.
What is the Average Family Size in Heeia
Average Family Size in Heeia is 3.3 People.
What is the Average Household Size in Heeia
Average Household Size in Heeia is 3.0 People.
What is Per Capita Income in Heeia?
Per Capita income in Heeia is $64,918.
What is the Median Family Income in Heeia?
Median Family Income in Heeia is $165,833.
What is the Median Household income in Heeia?
Median Household Income in Heeia is $143,214.
What is Income or Wage Gap in Heeia?
Income or Wage Gap in Heeia is 28.3%.
Women in Heeia earn 71.7 cents for every dollar earned by a man.
What is Inequality or Gini Index in Heeia?
Inequality or Gini Index in Heeia is 0.41.
How Large is the Labor Force in Heeia?
There are 2,638 People in the Labor Forcein in Heeia.
What is the Percentage of People in the Labor Force in Heeia?
64.4% of People are in the Labor Force in Heeia.
What is the Unemployment Rate in Heeia?
Unemployment Rate in Heeia is 2.1%.