Zip Codes with the Highest Percentage of Population Employed in Computer & Mathematics in Sarasota, FL

RELATED REPORTS & OPTIONS

Computer & Mathematics
Population
Families and Households
Female Fertility
Female Fertility (Unmarried)
Race (Community Size)
Race (Percentage)
Ancestry (Community Size)
AfricanAlbanianAlsatianAmericanApacheArabArgentineanArmenianAustralianAustrianBarbadianBasqueBelgianBermudanBhutaneseBlackfeetBolivianBrazilianBritishBulgarianBurmeseCanadianCentral AmericanCentral American IndianCherokeeChileanChippewaColombianCosta RicanCreekCroatianCubanCzechCzechoslovakianDanishDominicanDutchDutch West IndianEastern EuropeanEcuadorianEgyptianEnglishEuropeanFinnishFrenchFrench American IndianFrench CanadianGermanGreekGuatemalanGuyaneseHaitianHonduranHungarianIcelanderIndian (Asian)IranianIrishIroquoisIsraeliItalianJamaicanJapaneseKoreanLaotianLatvianLebaneseLithuanianMacedonianMalteseMexicanMexican American IndianMoroccanNative HawaiianNavajoNicaraguanNigerianNorthern EuropeanNorwegianOsagePakistaniPalestinianPanamanianPennsylvania GermanPeruvianPolishPortuguesePuerto RicanRomanianRussianSalvadoranScandinavianScotch-IrishScottishSeminoleSerbianSlavicSlovakSloveneSouth AfricanSouth AmericanSouth American IndianSpaniardSpanishSri LankanSubsaharan AfricanSwedishSwissSyrianThaiTrinidadian and TobagonianTurkishUkrainianVenezuelanWelshYugoslavian
Ancestry (Percentage)
AfricanAlbanianAlsatianAmericanApacheArabArgentineanArmenianAustralianAustrianBarbadianBasqueBelgianBermudanBhutaneseBlackfeetBolivianBrazilianBritishBulgarianBurmeseCanadianCentral AmericanCentral American IndianCherokeeChileanChippewaColombianCosta RicanCreekCroatianCubanCzechCzechoslovakianDanishDominicanDutchDutch West IndianEastern EuropeanEcuadorianEgyptianEnglishEuropeanFinnishFrenchFrench American IndianFrench CanadianGermanGreekGuatemalanGuyaneseHaitianHonduranHungarianIcelanderIndian (Asian)IranianIrishIroquoisIsraeliItalianJamaicanJapaneseKoreanLaotianLatvianLebaneseLithuanianMacedonianMalteseMexicanMexican American IndianMoroccanNative HawaiianNavajoNicaraguanNigerianNorthern EuropeanNorwegianOsagePakistaniPalestinianPanamanianPennsylvania GermanPeruvianPolishPortuguesePuerto RicanRomanianRussianSalvadoranScandinavianScotch-IrishScottishSeminoleSerbianSlavicSlovakSloveneSouth AfricanSouth AmericanSouth American IndianSpaniardSpanishSri LankanSubsaharan AfricanSwedishSwissSyrianThaiTrinidadian and TobagonianTurkishUkrainianVenezuelanWelshYugoslavian
Immigrant Origin (Total)
AfricaAlbaniaArgentinaAsiaAustraliaAustriaBahamasBarbadosBelarusBoliviaBosnia and HerzegovinaBrazilBulgariaBurma / MyanmarCanadaCaribbeanCentral AmericaChileChinaColombiaCosta RicaCroatiaCubaCzechoslovakiaDenmarkDominican RepublicEastern AfricaEastern AsiaEastern EuropeEcuadorEgyptEl SalvadorEnglandEuropeFranceGermanyGhanaGreeceGuatemalaGuyanaHaitiHondurasHong KongHungaryIndiaIndonesiaIranIrelandIsraelItalyJamaicaJapanKazakhstanKenyaKoreaLaosLatin AmericaLatviaLebanonLithuaniaMalaysiaMexicoMoldovaMoroccoNetherlandsNicaraguaNorthern AfricaNorthern EuropeNorwayOceaniaPanamaPeruPhilippinesPolandPortugalRomaniaRussiaScotlandSerbiaSouth AfricaSouth AmericaSouth Central AsiaSouth Eastern AsiaSouthern EuropeSpainSwedenSwitzerlandTaiwanThailandTrinidad and TobagoTurkeyUgandaUkraineVenezuelaVietnamWestern AfricaWestern AsiaWestern EuropeZimbabwe
Immigrant Origin (Percentage)
AfricaAlbaniaArgentinaAsiaAustraliaAustriaBahamasBarbadosBelarusBoliviaBosnia and HerzegovinaBrazilBulgariaBurma / MyanmarCanadaCaribbeanCentral AmericaChileChinaColombiaCosta RicaCroatiaCubaCzechoslovakiaDenmarkDominican RepublicEastern AfricaEastern AsiaEastern EuropeEcuadorEgyptEl SalvadorEnglandEuropeFranceGermanyGhanaGreeceGuatemalaGuyanaHaitiHondurasHong KongHungaryIndiaIndonesiaIranIrelandIsraelItalyJamaicaJapanKazakhstanKenyaKoreaLaosLatin AmericaLatviaLebanonLithuaniaMalaysiaMexicoMoldovaMoroccoNetherlandsNicaraguaNorthern AfricaNorthern EuropeNorwayOceaniaPanamaPeruPhilippinesPolandPortugalRomaniaRussiaScotlandSerbiaSouth AfricaSouth AmericaSouth Central AsiaSouth Eastern AsiaSouthern EuropeSpainSwedenSwitzerlandTaiwanThailandTrinidad and TobagoTurkeyUgandaUkraineVenezuelaVietnamWestern AfricaWestern AsiaWestern EuropeZimbabwe
Income
Income (Families)
Income (Households)
Poverty
Poverty (Families)
Unemployment
Employment Occupations
Employment Industries
Employer Class
Commute Time
Commute Means
School Enrollment
Education by Degree Field
Occupancy
Finances
Physical Characteristics
Sarasota
States
Florida Cities
Altamonte SpringsApopkaBoca RatonBonita SpringsBoynton BeachBradentonBrandonBrooksvilleCape CoralCasselberryClearwaterClermontCocoaCoral SpringsCrestviewCrystal RiverDade CityDavenportDaytona BeachDeerfield BeachDefuniak SpringsDelandDelray BeachDeltonaDunnellonEdgewaterEnglewoodEustisFort LauderdaleFort MyersFort PierceFort Walton BeachGainesvilleGulf BreezeHialeahHolidayHollywoodHomesteadHomosassaHudsonInvernessJacksonvilleJupiterKissimmeeLake CityLake WalesLake WorthLakelandLand O LakesLargoLeesburgLehigh AcresLive OakLongwoodLutzMariannaMelbourneMerritt IslandMiamiMiami BeachMiltonNaplesNew Port RicheyNew Smyrna BeachNorth Fort MyersNorth PortOcalaOkeechobeeOpa LockaOrange ParkOrlandoOrmond BeachOviedoPalm BayPalm Beach GardensPalm CoastPalm HarborPanama CityPanama City BeachPensacolaPinellas ParkPlant CityPompano BeachPort CharlottePort OrangePort Saint LuciePunta GordaRiverviewSaint AugustineSaint CloudSaint PetersburgSanfordSarasotaSebastianSebringSeminoleSpring HillStuartTallahasseeTampaTarpon SpringsThe VillagesTitusvilleValricoVeniceVero BeachWesley ChapelWest Palm BeachWinter HavenWinter ParkZephyrhills
Compare Zip Codes
Comparison Subject

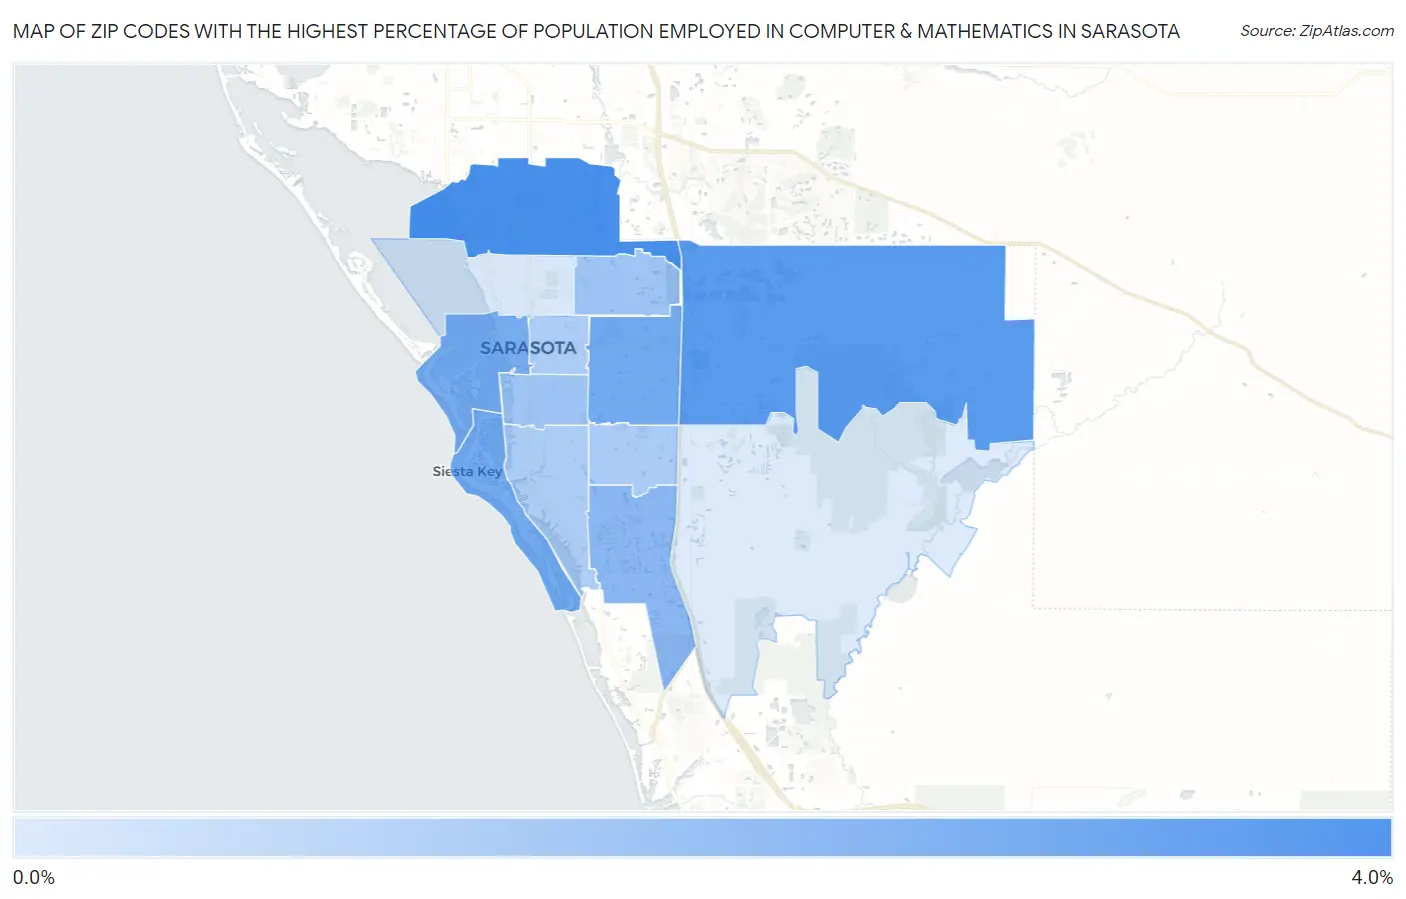
Map of Zip Codes with the Highest Percentage of Population Employed in Computer & Mathematics in Sarasota

0.0%
4.0%
Zip Codes with the Highest Percentage of Population Employed in Computer & Mathematics in Sarasota Map

Zip Codes with the Highest Percentage of Population Employed in Computer & Mathematics in Sarasota, FL

Zip Code % Employed vs State vs National
1.342433.6%2.9%(+0.664)#2453.5%(+0.045)#6,014
2.342403.3%2.9%(+0.368)#2903.5%(-0.251)#6,859
3.342322.7%2.9%(-0.208)#3883.5%(-0.827)#8,827
4.342422.7%2.9%(-0.253)#3963.5%(-0.872)#9,021
5.342362.6%2.9%(-0.311)#4053.5%(-0.930)#9,235
6.342382.2%2.9%(-0.666)#4643.5%(-1.29)#10,717
7.342391.9%2.9%(-1.04)#5453.5%(-1.66)#12,439
8.342351.8%2.9%(-1.06)#5523.5%(-1.68)#12,571
9.342331.6%2.9%(-1.27)#6043.5%(-1.89)#13,613
10.342371.6%2.9%(-1.31)#6083.5%(-1.92)#13,805
11.342311.6%2.9%(-1.33)#6163.5%(-1.95)#13,963
12.342340.74%2.9%(-2.16)#7883.5%(-2.78)#18,988
13.342410.64%2.9%(-2.26)#8023.5%(-2.88)#19,612

Common Questions

What are the Top 10 Zip Codes with the Highest Percentage of Population Employed in Computer & Mathematics in Sarasota, FL?
Top 10 Zip Codes with the Highest Percentage of Population Employed in Computer & Mathematics in Sarasota, FL are:
#1
3.6%
#2
3.3%
#3
2.7%
#4
2.7%
#5
2.6%
#6
2.2%
#7
1.9%
#8
1.8%
#9
1.6%
#10
1.6%
What zip code has the Highest Percentage of Population Employed in Computer & Mathematics in Sarasota, FL?
34243 has the Highest Percentage of Population Employed in Computer & Mathematics in Sarasota, FL with 3.6%.
What is the Percentage of Population Employed in Computer & Mathematics in Sarasota, FL?
Percentage of Population Employed in Computer & Mathematics in Sarasota is 1.8%.
What is the Percentage of Population Employed in Computer & Mathematics in Florida?
Percentage of Population Employed in Computer & Mathematics in Florida is 2.9%.
What is the Percentage of Population Employed in Computer & Mathematics in the United States?
Percentage of Population Employed in Computer & Mathematics in the United States is 3.5%.