Yuman vs French American Indian Currently Married
COMPARE
Yuman
French American Indian
Currently Married
Currently Married Comparison
Yuman
French American Indians
42.6%
CURRENTLY MARRIED
0.0/ 100
METRIC RATING
293rd/ 347
METRIC RANK
45.0%
CURRENTLY MARRIED
2.2/ 100
METRIC RATING
225th/ 347
METRIC RANK
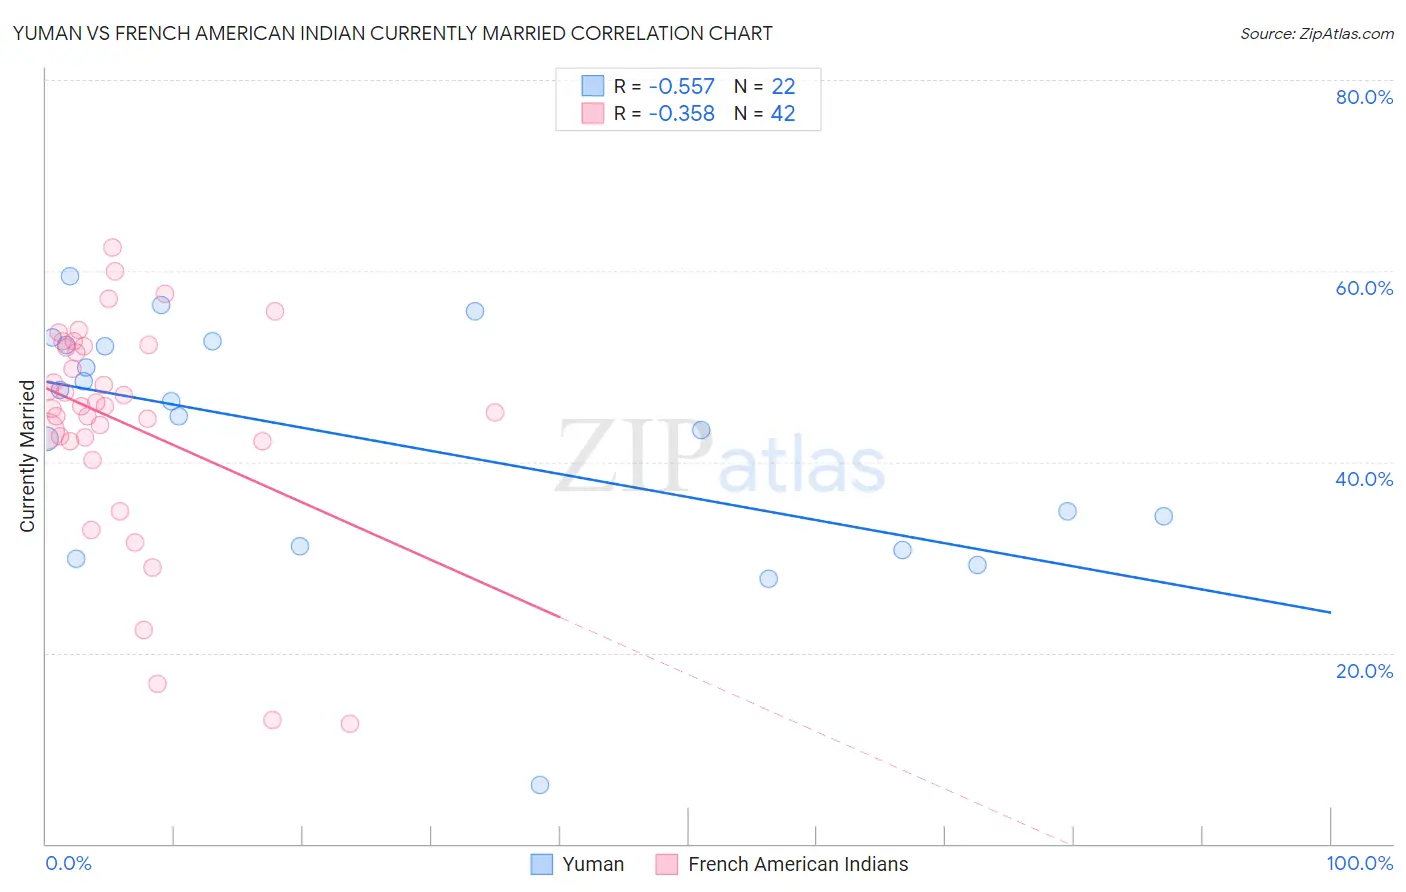
Yuman vs French American Indian Currently Married Correlation Chart
The statistical analysis conducted on geographies consisting of 40,696,202 people shows a substantial negative correlation between the proportion of Yuman and percentage of population currently married in the United States with a correlation coefficient (R) of -0.557 and weighted average of 42.6%. Similarly, the statistical analysis conducted on geographies consisting of 131,975,724 people shows a mild negative correlation between the proportion of French American Indians and percentage of population currently married in the United States with a correlation coefficient (R) of -0.358 and weighted average of 45.0%, a difference of 5.7%.
Currently Married Correlation Summary
| Measurement | Yuman | French American Indian |
| Minimum | 6.1% | 12.6% |
| Maximum | 59.4% | 62.4% |
| Range | 53.3% | 49.8% |
| Mean | 42.2% | 44.1% |
| Median | 45.5% | 45.8% |
| Interquartile 25% (IQ1) | 31.2% | 42.2% |
| Interquartile 75% (IQ3) | 52.2% | 52.2% |
| Interquartile Range (IQR) | 21.0% | 9.9% |
| Standard Deviation (Sample) | 12.8% | 11.7% |
| Standard Deviation (Population) | 12.5% | 11.5% |
Similar Demographics by Currently Married
Demographics Similar to Yuman by Currently Married
In terms of currently married, the demographic groups most similar to Yuman are Subsaharan African (42.6%, a difference of 0.020%), Honduran (42.5%, a difference of 0.12%), Immigrants from Guatemala (42.6%, a difference of 0.18%), Immigrants from Ghana (42.7%, a difference of 0.29%), and Paiute (42.7%, a difference of 0.30%).
| Demographics | Rating | Rank | Currently Married |
| Ghanaians | 0.0 /100 | #286 | Tragic 42.9% |
| Guatemalans | 0.0 /100 | #287 | Tragic 42.9% |
| Natives/Alaskans | 0.0 /100 | #288 | Tragic 42.8% |
| Paiute | 0.0 /100 | #289 | Tragic 42.7% |
| Immigrants | Ghana | 0.0 /100 | #290 | Tragic 42.7% |
| Immigrants | Guatemala | 0.0 /100 | #291 | Tragic 42.6% |
| Sub-Saharan Africans | 0.0 /100 | #292 | Tragic 42.6% |
| Yuman | 0.0 /100 | #293 | Tragic 42.6% |
| Hondurans | 0.0 /100 | #294 | Tragic 42.5% |
| Immigrants | Western Africa | 0.0 /100 | #295 | Tragic 42.4% |
| Menominee | 0.0 /100 | #296 | Tragic 42.3% |
| Cheyenne | 0.0 /100 | #297 | Tragic 42.2% |
| Immigrants | Honduras | 0.0 /100 | #298 | Tragic 42.2% |
| Liberians | 0.0 /100 | #299 | Tragic 42.2% |
| Belizeans | 0.0 /100 | #300 | Tragic 42.2% |
Demographics Similar to French American Indians by Currently Married
In terms of currently married, the demographic groups most similar to French American Indians are Immigrants from Uganda (45.0%, a difference of 0.0%), Immigrants from Laos (45.0%, a difference of 0.050%), Comanche (45.0%, a difference of 0.050%), Spanish American (45.0%, a difference of 0.050%), and Immigrants from Uruguay (45.0%, a difference of 0.060%).
| Demographics | Rating | Rank | Currently Married |
| Panamanians | 4.0 /100 | #218 | Tragic 45.3% |
| Immigrants | Portugal | 3.5 /100 | #219 | Tragic 45.2% |
| Kenyans | 3.1 /100 | #220 | Tragic 45.2% |
| Mexicans | 3.0 /100 | #221 | Tragic 45.2% |
| Immigrants | Azores | 2.5 /100 | #222 | Tragic 45.1% |
| Immigrants | Laos | 2.3 /100 | #223 | Tragic 45.0% |
| Immigrants | Uganda | 2.2 /100 | #224 | Tragic 45.0% |
| French American Indians | 2.2 /100 | #225 | Tragic 45.0% |
| Comanche | 2.1 /100 | #226 | Tragic 45.0% |
| Spanish Americans | 2.1 /100 | #227 | Tragic 45.0% |
| Immigrants | Uruguay | 2.0 /100 | #228 | Tragic 45.0% |
| Cree | 1.7 /100 | #229 | Tragic 44.9% |
| Immigrants | Kenya | 1.6 /100 | #230 | Tragic 44.9% |
| Immigrants | Panama | 1.5 /100 | #231 | Tragic 44.9% |
| Nepalese | 1.2 /100 | #232 | Tragic 44.7% |