White/Caucasian vs Lumbee Divorced or Separated
COMPARE
White/Caucasian
Lumbee
Divorced or Separated
Divorced or Separated Comparison
Whites/Caucasians
Lumbee
12.6%
DIVORCED OR SEPARATED
0.5/ 100
METRIC RATING
266th/ 347
METRIC RANK
12.7%
DIVORCED OR SEPARATED
0.2/ 100
METRIC RATING
278th/ 347
METRIC RANK
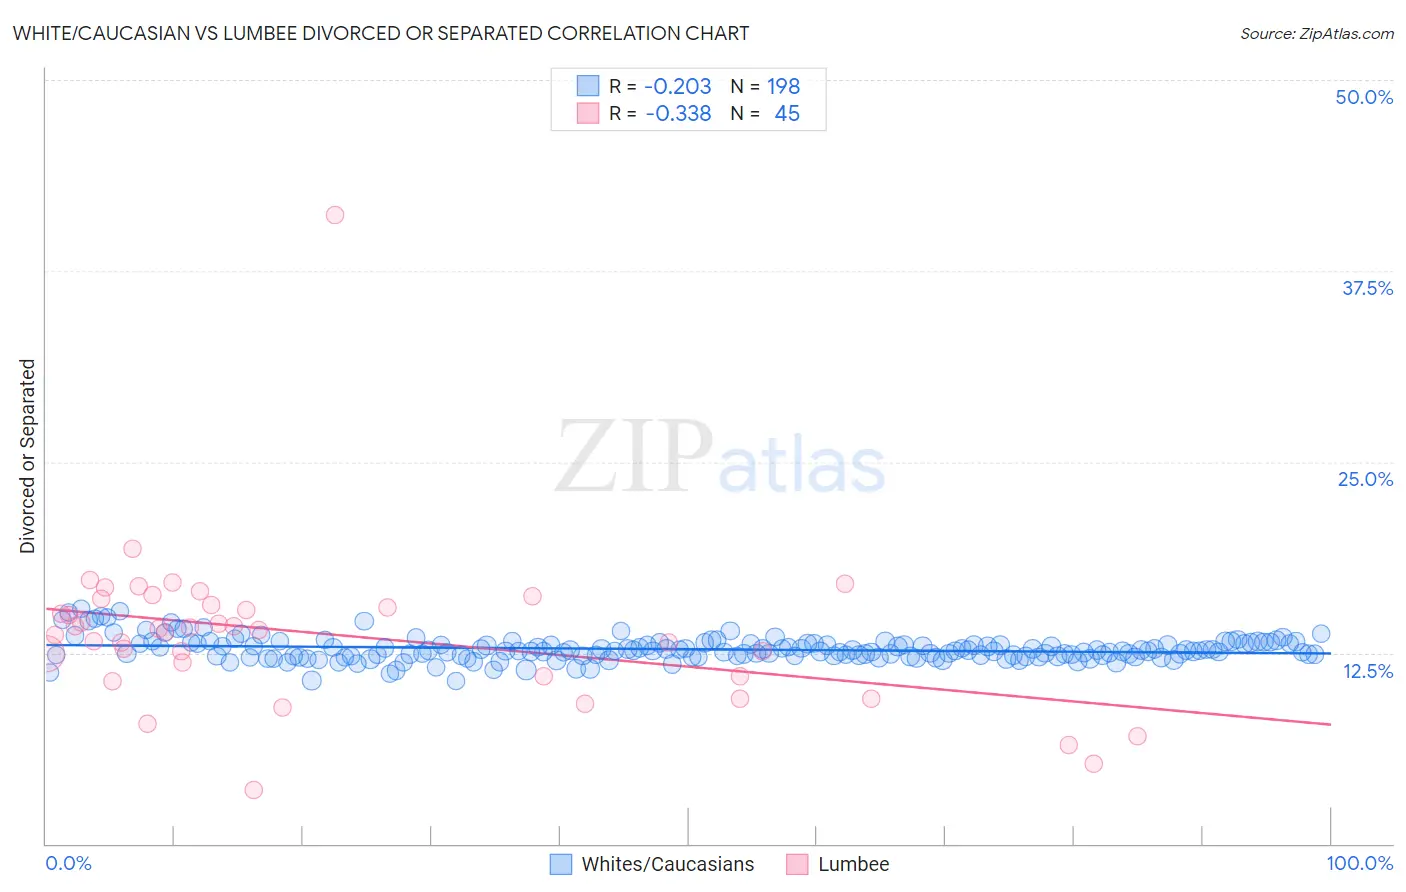
White/Caucasian vs Lumbee Divorced or Separated Correlation Chart
The statistical analysis conducted on geographies consisting of 582,391,050 people shows a weak negative correlation between the proportion of Whites/Caucasians and percentage of population currently divorced or separated in the United States with a correlation coefficient (R) of -0.203 and weighted average of 12.6%. Similarly, the statistical analysis conducted on geographies consisting of 92,287,326 people shows a mild negative correlation between the proportion of Lumbee and percentage of population currently divorced or separated in the United States with a correlation coefficient (R) of -0.338 and weighted average of 12.7%, a difference of 0.72%.
Divorced or Separated Correlation Summary
| Measurement | White/Caucasian | Lumbee |
| Minimum | 10.6% | 3.5% |
| Maximum | 15.4% | 41.2% |
| Range | 4.7% | 37.7% |
| Mean | 12.7% | 13.7% |
| Median | 12.6% | 14.0% |
| Interquartile 25% (IQ1) | 12.3% | 11.0% |
| Interquartile 75% (IQ3) | 13.1% | 15.9% |
| Interquartile Range (IQR) | 0.82% | 4.9% |
| Standard Deviation (Sample) | 0.77% | 5.4% |
| Standard Deviation (Population) | 0.77% | 5.4% |
Demographics Similar to Whites/Caucasians and Lumbee by Divorced or Separated
In terms of divorced or separated, the demographic groups most similar to Whites/Caucasians are Immigrants from Senegal (12.6%, a difference of 0.010%), English (12.6%, a difference of 0.030%), Scottish (12.6%, a difference of 0.040%), Immigrants from Panama (12.6%, a difference of 0.050%), and Fijian (12.6%, a difference of 0.060%). Similarly, the demographic groups most similar to Lumbee are Immigrants from Dominican Republic (12.7%, a difference of 0.010%), Immigrants from Zaire (12.7%, a difference of 0.080%), Pueblo (12.7%, a difference of 0.11%), Dominican (12.7%, a difference of 0.16%), and Spaniard (12.7%, a difference of 0.21%).
| Demographics | Rating | Rank | Divorced or Separated |
| Basques | 0.5 /100 | #262 | Tragic 12.6% |
| Immigrants | Panama | 0.5 /100 | #263 | Tragic 12.6% |
| English | 0.5 /100 | #264 | Tragic 12.6% |
| Immigrants | Senegal | 0.5 /100 | #265 | Tragic 12.6% |
| Whites/Caucasians | 0.5 /100 | #266 | Tragic 12.6% |
| Scottish | 0.4 /100 | #267 | Tragic 12.6% |
| Fijians | 0.4 /100 | #268 | Tragic 12.6% |
| Immigrants | Liberia | 0.4 /100 | #269 | Tragic 12.6% |
| Ute | 0.4 /100 | #270 | Tragic 12.6% |
| Panamanians | 0.3 /100 | #271 | Tragic 12.7% |
| Immigrants | Middle Africa | 0.3 /100 | #272 | Tragic 12.7% |
| Immigrants | Micronesia | 0.3 /100 | #273 | Tragic 12.7% |
| Bermudans | 0.3 /100 | #274 | Tragic 12.7% |
| Central American Indians | 0.3 /100 | #275 | Tragic 12.7% |
| Spaniards | 0.2 /100 | #276 | Tragic 12.7% |
| Dominicans | 0.2 /100 | #277 | Tragic 12.7% |
| Lumbee | 0.2 /100 | #278 | Tragic 12.7% |
| Immigrants | Dominican Republic | 0.2 /100 | #279 | Tragic 12.7% |
| Immigrants | Zaire | 0.2 /100 | #280 | Tragic 12.7% |
| Pueblo | 0.2 /100 | #281 | Tragic 12.7% |
| Sub-Saharan Africans | 0.1 /100 | #282 | Tragic 12.7% |