White/Caucasian vs Immigrants from Netherlands Family Households with Children
COMPARE
White/Caucasian
Immigrants from Netherlands
Family Households with Children
Family Households with Children Comparison
Whites/Caucasians
Immigrants from Netherlands
27.4%
FAMILY HOUSEHOLDS WITH CHILDREN
50.0/ 100
METRIC RATING
174th/ 347
METRIC RANK
26.9%
FAMILY HOUSEHOLDS WITH CHILDREN
3.5/ 100
METRIC RATING
237th/ 347
METRIC RANK
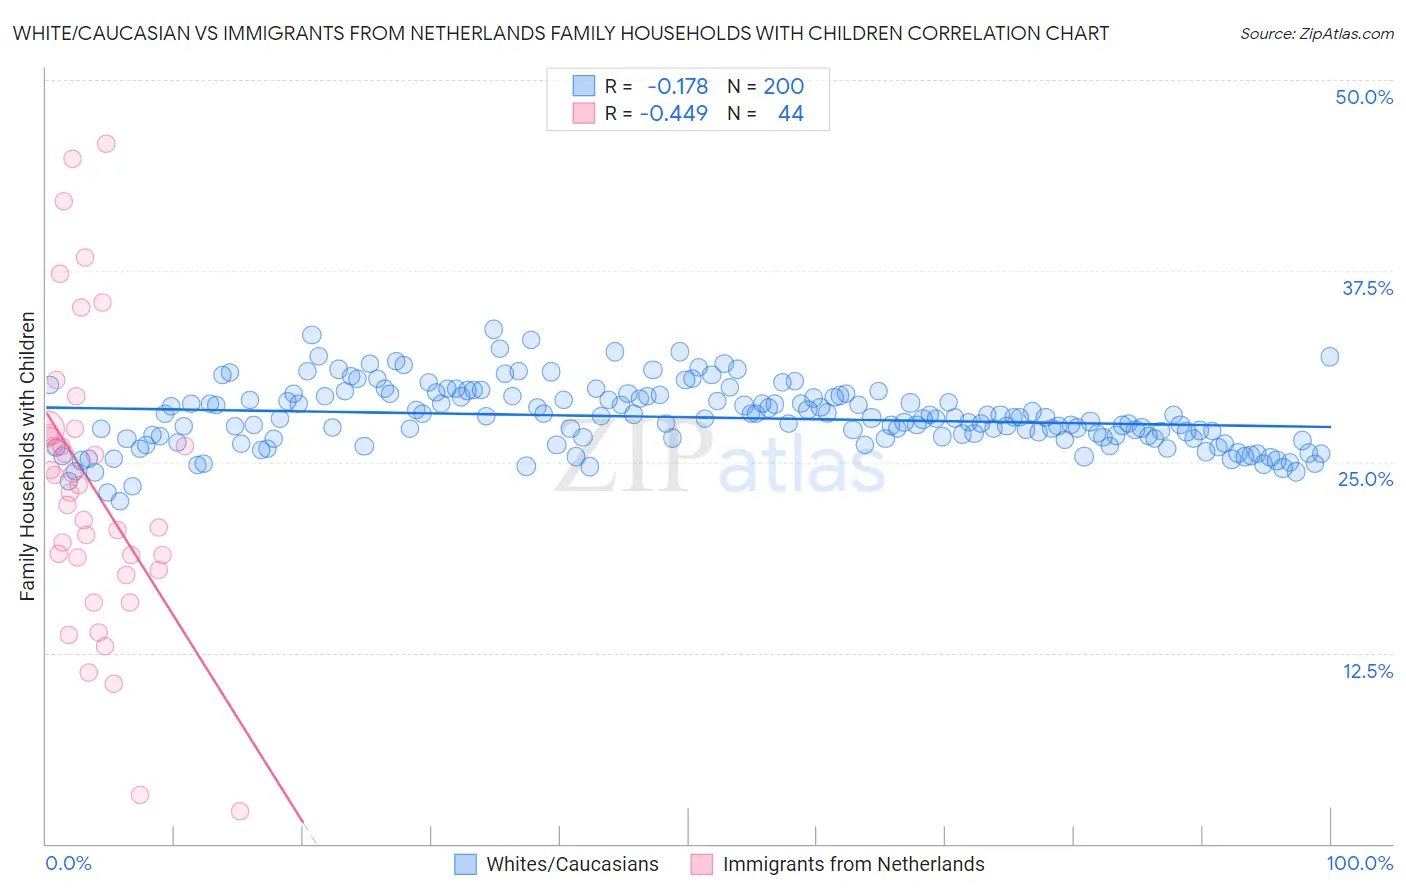
White/Caucasian vs Immigrants from Netherlands Family Households with Children Correlation Chart
The statistical analysis conducted on geographies consisting of 583,762,337 people shows a poor negative correlation between the proportion of Whites/Caucasians and percentage of family households with children in the United States with a correlation coefficient (R) of -0.178 and weighted average of 27.4%. Similarly, the statistical analysis conducted on geographies consisting of 237,672,305 people shows a moderate negative correlation between the proportion of Immigrants from Netherlands and percentage of family households with children in the United States with a correlation coefficient (R) of -0.449 and weighted average of 26.9%, a difference of 1.9%.
Family Households with Children Correlation Summary
| Measurement | White/Caucasian | Immigrants from Netherlands |
| Minimum | 22.4% | 2.1% |
| Maximum | 33.7% | 45.8% |
| Range | 11.3% | 43.7% |
| Mean | 27.9% | 23.4% |
| Median | 27.8% | 23.2% |
| Interquartile 25% (IQ1) | 26.5% | 18.3% |
| Interquartile 75% (IQ3) | 29.3% | 27.0% |
| Interquartile Range (IQR) | 2.8% | 8.7% |
| Standard Deviation (Sample) | 2.1% | 9.6% |
| Standard Deviation (Population) | 2.1% | 9.5% |
Similar Demographics by Family Households with Children
Demographics Similar to Whites/Caucasians by Family Households with Children
In terms of family households with children, the demographic groups most similar to Whites/Caucasians are British (27.4%, a difference of 0.0%), Immigrants from China (27.4%, a difference of 0.010%), Ugandan (27.4%, a difference of 0.020%), Spanish American (27.4%, a difference of 0.020%), and Immigrants from Argentina (27.5%, a difference of 0.050%).
| Demographics | Rating | Rank | Family Households with Children |
| Dominicans | 61.1 /100 | #167 | Good 27.5% |
| Immigrants | Kuwait | 60.9 /100 | #168 | Good 27.5% |
| Seminole | 56.9 /100 | #169 | Average 27.5% |
| Cherokee | 56.7 /100 | #170 | Average 27.5% |
| Blackfeet | 54.3 /100 | #171 | Average 27.5% |
| Israelis | 53.9 /100 | #172 | Average 27.5% |
| Immigrants | Argentina | 52.2 /100 | #173 | Average 27.5% |
| Whites/Caucasians | 50.0 /100 | #174 | Average 27.4% |
| British | 49.9 /100 | #175 | Average 27.4% |
| Immigrants | China | 49.6 /100 | #176 | Average 27.4% |
| Ugandans | 49.2 /100 | #177 | Average 27.4% |
| Spanish Americans | 48.9 /100 | #178 | Average 27.4% |
| Turks | 46.9 /100 | #179 | Average 27.4% |
| Immigrants | Turkey | 46.9 /100 | #180 | Average 27.4% |
| Aleuts | 46.7 /100 | #181 | Average 27.4% |
Demographics Similar to Immigrants from Netherlands by Family Households with Children
In terms of family households with children, the demographic groups most similar to Immigrants from Netherlands are Moroccan (26.9%, a difference of 0.010%), Cape Verdean (26.9%, a difference of 0.020%), Immigrants from Southern Europe (26.9%, a difference of 0.020%), Immigrants from Bulgaria (26.9%, a difference of 0.030%), and Navajo (26.9%, a difference of 0.040%).
| Demographics | Rating | Rank | Family Households with Children |
| Bulgarians | 5.8 /100 | #230 | Tragic 27.0% |
| Luxembourgers | 5.5 /100 | #231 | Tragic 27.0% |
| Yugoslavians | 5.1 /100 | #232 | Tragic 27.0% |
| Immigrants | Italy | 5.0 /100 | #233 | Tragic 27.0% |
| Immigrants | Germany | 4.4 /100 | #234 | Tragic 27.0% |
| Immigrants | Morocco | 4.2 /100 | #235 | Tragic 27.0% |
| Cape Verdeans | 3.6 /100 | #236 | Tragic 26.9% |
| Immigrants | Netherlands | 3.5 /100 | #237 | Tragic 26.9% |
| Moroccans | 3.4 /100 | #238 | Tragic 26.9% |
| Immigrants | Southern Europe | 3.4 /100 | #239 | Tragic 26.9% |
| Immigrants | Bulgaria | 3.3 /100 | #240 | Tragic 26.9% |
| Navajo | 3.2 /100 | #241 | Tragic 26.9% |
| Immigrants | England | 3.2 /100 | #242 | Tragic 26.9% |
| Immigrants | Saudi Arabia | 2.9 /100 | #243 | Tragic 26.9% |
| Ukrainians | 2.9 /100 | #244 | Tragic 26.9% |