Vietnamese vs Jordanian Family Households
COMPARE
Vietnamese
Jordanian
Family Households
Family Households Comparison
Vietnamese
Jordanians
64.2%
FAMILY HOUSEHOLDS
43.6/ 100
METRIC RATING
176th/ 347
METRIC RANK
65.5%
FAMILY HOUSEHOLDS
99.7/ 100
METRIC RATING
81st/ 347
METRIC RANK
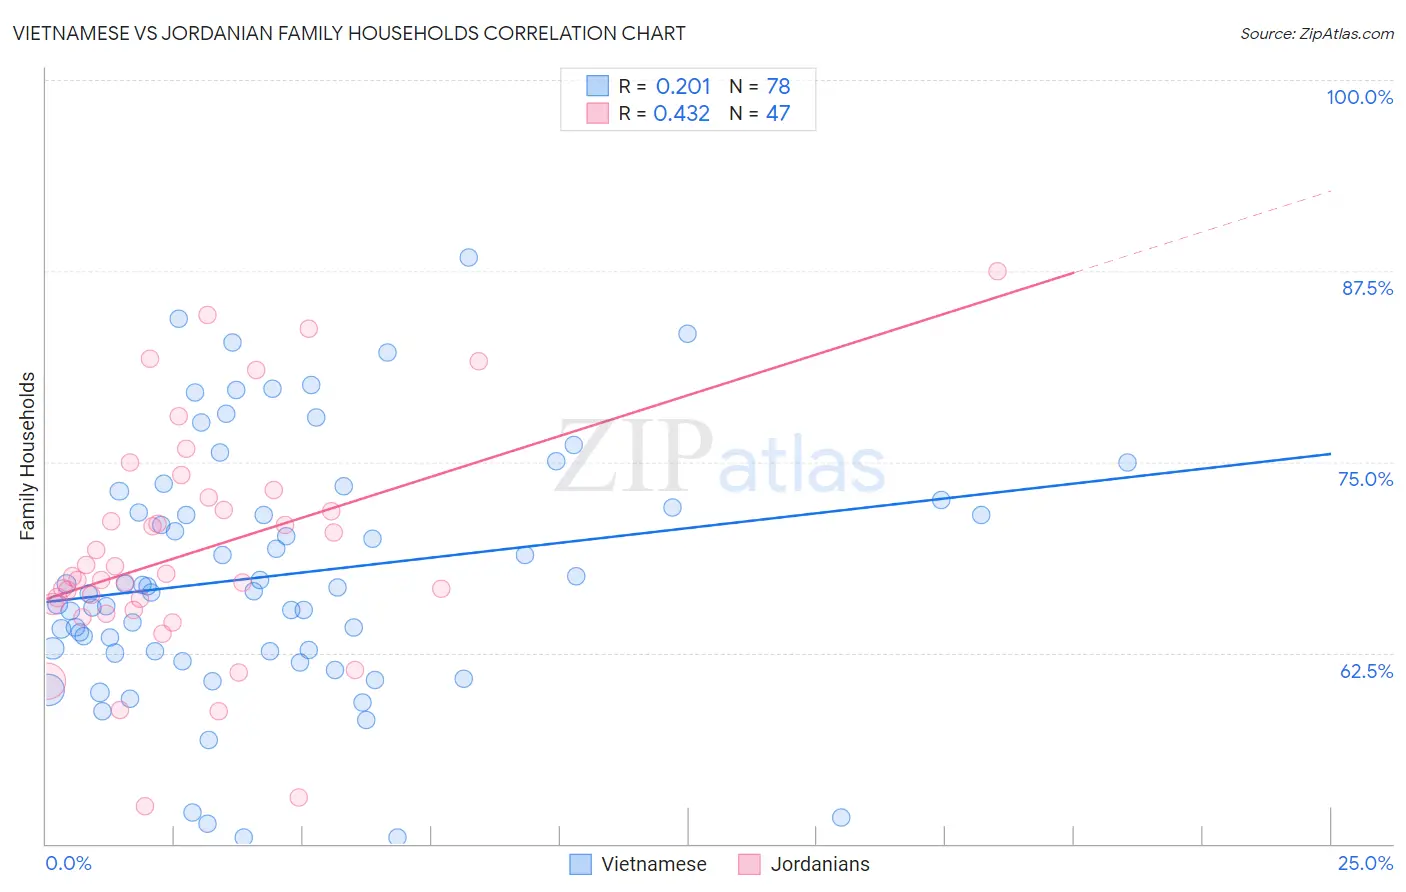
Vietnamese vs Jordanian Family Households Correlation Chart
The statistical analysis conducted on geographies consisting of 170,660,607 people shows a weak positive correlation between the proportion of Vietnamese and percentage of family households in the United States with a correlation coefficient (R) of 0.201 and weighted average of 64.2%. Similarly, the statistical analysis conducted on geographies consisting of 166,395,405 people shows a moderate positive correlation between the proportion of Jordanians and percentage of family households in the United States with a correlation coefficient (R) of 0.432 and weighted average of 65.5%, a difference of 2.0%.
Family Households Correlation Summary
| Measurement | Vietnamese | Jordanian |
| Minimum | 50.4% | 52.5% |
| Maximum | 88.4% | 87.5% |
| Range | 38.0% | 35.0% |
| Mean | 67.6% | 69.1% |
| Median | 66.7% | 67.5% |
| Interquartile 25% (IQ1) | 62.6% | 65.3% |
| Interquartile 75% (IQ3) | 72.5% | 72.6% |
| Interquartile Range (IQR) | 9.9% | 7.3% |
| Standard Deviation (Sample) | 8.2% | 7.5% |
| Standard Deviation (Population) | 8.2% | 7.5% |
Similar Demographics by Family Households
Demographics Similar to Vietnamese by Family Households
In terms of family households, the demographic groups most similar to Vietnamese are Bangladeshi (64.3%, a difference of 0.010%), Immigrants from Micronesia (64.2%, a difference of 0.020%), Jamaican (64.2%, a difference of 0.040%), Immigrants from Ukraine (64.2%, a difference of 0.080%), and Immigrants from Germany (64.3%, a difference of 0.090%).
| Demographics | Rating | Rank | Family Households |
| Iraqis | 56.0 /100 | #169 | Average 64.4% |
| Armenians | 55.9 /100 | #170 | Average 64.4% |
| Ute | 54.6 /100 | #171 | Average 64.3% |
| Dutch West Indians | 53.9 /100 | #172 | Average 64.3% |
| Immigrants | Sierra Leone | 52.5 /100 | #173 | Average 64.3% |
| Immigrants | Germany | 50.0 /100 | #174 | Average 64.3% |
| Bangladeshis | 44.3 /100 | #175 | Average 64.3% |
| Vietnamese | 43.6 /100 | #176 | Average 64.2% |
| Immigrants | Micronesia | 42.3 /100 | #177 | Average 64.2% |
| Jamaicans | 40.6 /100 | #178 | Average 64.2% |
| Immigrants | Ukraine | 38.2 /100 | #179 | Fair 64.2% |
| Immigrants | Honduras | 35.0 /100 | #180 | Fair 64.2% |
| Immigrants | Trinidad and Tobago | 34.9 /100 | #181 | Fair 64.2% |
| Ukrainians | 34.6 /100 | #182 | Fair 64.2% |
| Creek | 34.1 /100 | #183 | Fair 64.2% |
Demographics Similar to Jordanians by Family Households
In terms of family households, the demographic groups most similar to Jordanians are Immigrants from Lebanon (65.5%, a difference of 0.040%), Immigrants from Guyana (65.5%, a difference of 0.040%), American (65.5%, a difference of 0.060%), Puget Sound Salish (65.6%, a difference of 0.080%), and Immigrants from Costa Rica (65.6%, a difference of 0.10%).
| Demographics | Rating | Rank | Family Households |
| Burmese | 99.9 /100 | #74 | Exceptional 65.7% |
| Houma | 99.9 /100 | #75 | Exceptional 65.7% |
| Immigrants | Azores | 99.8 /100 | #76 | Exceptional 65.6% |
| Immigrants | South America | 99.8 /100 | #77 | Exceptional 65.6% |
| Yaqui | 99.8 /100 | #78 | Exceptional 65.6% |
| Immigrants | Costa Rica | 99.8 /100 | #79 | Exceptional 65.6% |
| Puget Sound Salish | 99.8 /100 | #80 | Exceptional 65.6% |
| Jordanians | 99.7 /100 | #81 | Exceptional 65.5% |
| Immigrants | Lebanon | 99.7 /100 | #82 | Exceptional 65.5% |
| Immigrants | Guyana | 99.6 /100 | #83 | Exceptional 65.5% |
| Americans | 99.6 /100 | #84 | Exceptional 65.5% |
| Immigrants | Cambodia | 99.5 /100 | #85 | Exceptional 65.4% |
| Egyptians | 99.4 /100 | #86 | Exceptional 65.4% |
| Immigrants | Egypt | 99.2 /100 | #87 | Exceptional 65.3% |
| Immigrants | Haiti | 99.1 /100 | #88 | Exceptional 65.3% |