Trinidadian and Tobagonian vs Immigrants from South Eastern Asia Family Households
COMPARE
Trinidadian and Tobagonian
Immigrants from South Eastern Asia
Family Households
Family Households Comparison
Trinidadians and Tobagonians
Immigrants from South Eastern Asia
63.6%
FAMILY HOUSEHOLDS
4.1/ 100
METRIC RATING
227th/ 347
METRIC RANK
67.5%
FAMILY HOUSEHOLDS
100.0/ 100
METRIC RATING
24th/ 347
METRIC RANK
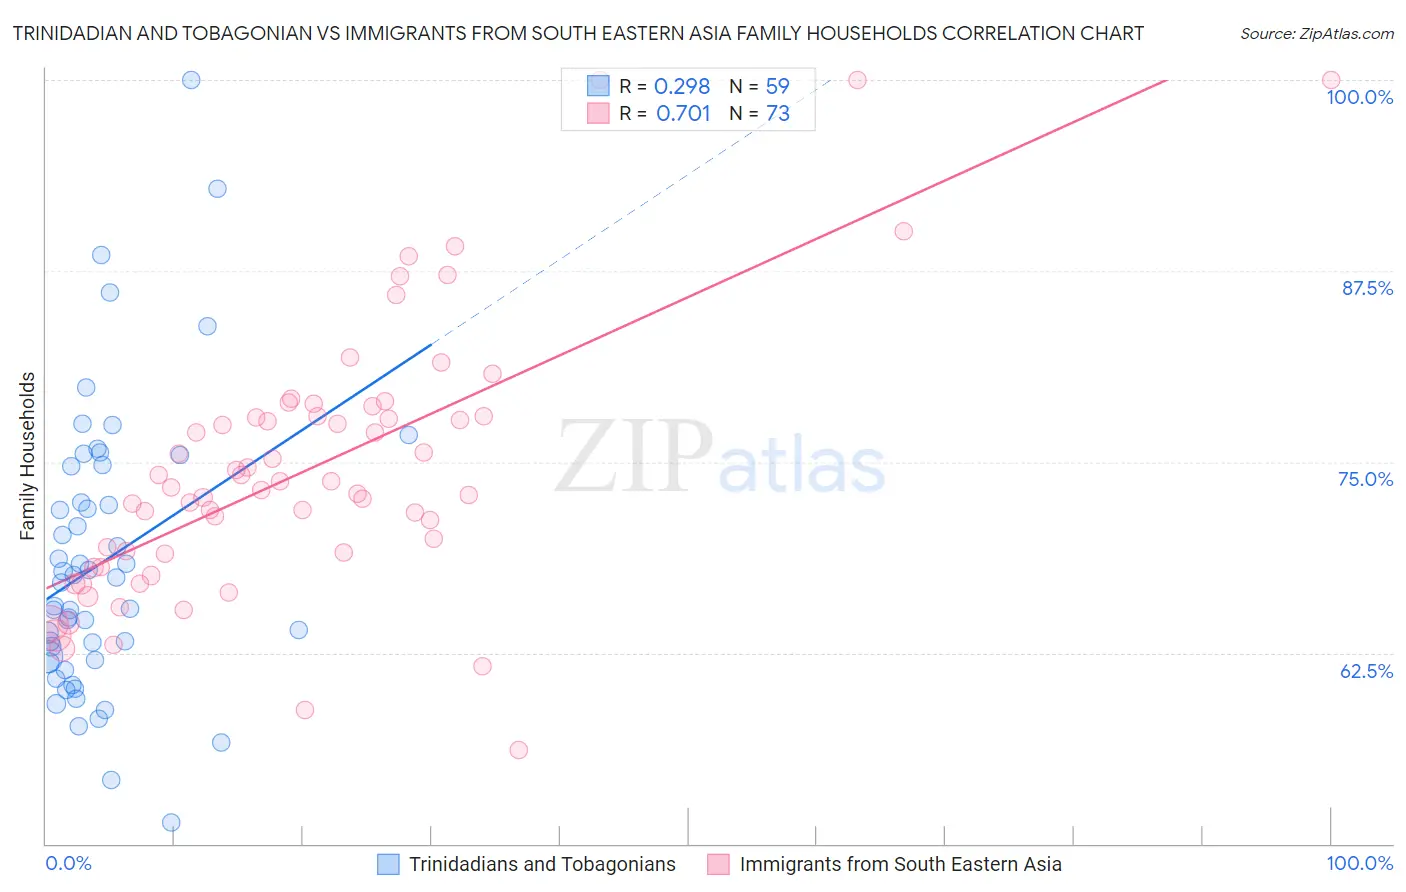
Trinidadian and Tobagonian vs Immigrants from South Eastern Asia Family Households Correlation Chart
The statistical analysis conducted on geographies consisting of 219,716,618 people shows a weak positive correlation between the proportion of Trinidadians and Tobagonians and percentage of family households in the United States with a correlation coefficient (R) of 0.298 and weighted average of 63.6%. Similarly, the statistical analysis conducted on geographies consisting of 512,232,151 people shows a strong positive correlation between the proportion of Immigrants from South Eastern Asia and percentage of family households in the United States with a correlation coefficient (R) of 0.701 and weighted average of 67.5%, a difference of 6.1%.
Family Households Correlation Summary
| Measurement | Trinidadian and Tobagonian | Immigrants from South Eastern Asia |
| Minimum | 51.4% | 56.2% |
| Maximum | 100.0% | 100.0% |
| Range | 48.6% | 43.8% |
| Mean | 68.4% | 74.5% |
| Median | 67.1% | 73.4% |
| Interquartile 25% (IQ1) | 62.1% | 68.5% |
| Interquartile 75% (IQ3) | 74.7% | 78.0% |
| Interquartile Range (IQR) | 12.7% | 9.4% |
| Standard Deviation (Sample) | 9.3% | 8.8% |
| Standard Deviation (Population) | 9.2% | 8.7% |
Similar Demographics by Family Households
Demographics Similar to Trinidadians and Tobagonians by Family Households
In terms of family households, the demographic groups most similar to Trinidadians and Tobagonians are Immigrants from Bahamas (63.6%, a difference of 0.010%), Immigrants from Hungary (63.6%, a difference of 0.020%), Turkish (63.6%, a difference of 0.030%), Blackfeet (63.6%, a difference of 0.050%), and Bulgarian (63.6%, a difference of 0.070%).
| Demographics | Rating | Rank | Family Households |
| Immigrants | Europe | 6.4 /100 | #220 | Tragic 63.7% |
| Immigrants | South Africa | 5.9 /100 | #221 | Tragic 63.7% |
| Immigrants | Belarus | 5.5 /100 | #222 | Tragic 63.7% |
| French Canadians | 5.4 /100 | #223 | Tragic 63.7% |
| Turks | 4.5 /100 | #224 | Tragic 63.6% |
| Immigrants | Hungary | 4.3 /100 | #225 | Tragic 63.6% |
| Immigrants | Bahamas | 4.2 /100 | #226 | Tragic 63.6% |
| Trinidadians and Tobagonians | 4.1 /100 | #227 | Tragic 63.6% |
| Blackfeet | 3.6 /100 | #228 | Tragic 63.6% |
| Bulgarians | 3.4 /100 | #229 | Tragic 63.6% |
| Immigrants | Brazil | 3.0 /100 | #230 | Tragic 63.6% |
| Immigrants | Greece | 2.9 /100 | #231 | Tragic 63.5% |
| Immigrants | Northern Africa | 2.6 /100 | #232 | Tragic 63.5% |
| Immigrants | Armenia | 2.6 /100 | #233 | Tragic 63.5% |
| Finns | 2.3 /100 | #234 | Tragic 63.5% |
Demographics Similar to Immigrants from South Eastern Asia by Family Households
In terms of family households, the demographic groups most similar to Immigrants from South Eastern Asia are Immigrants from Nicaragua (67.5%, a difference of 0.020%), Immigrants from India (67.4%, a difference of 0.040%), Hispanic or Latino (67.4%, a difference of 0.080%), Hawaiian (67.4%, a difference of 0.090%), and Nicaraguan (67.4%, a difference of 0.16%).
| Demographics | Rating | Rank | Family Households |
| Chinese | 100.0 /100 | #17 | Exceptional 68.1% |
| Immigrants | Taiwan | 100.0 /100 | #18 | Exceptional 68.0% |
| Samoans | 100.0 /100 | #19 | Exceptional 67.9% |
| Inupiat | 100.0 /100 | #20 | Exceptional 67.8% |
| Cubans | 100.0 /100 | #21 | Exceptional 67.7% |
| Sri Lankans | 100.0 /100 | #22 | Exceptional 67.7% |
| Immigrants | Pakistan | 100.0 /100 | #23 | Exceptional 67.7% |
| Immigrants | South Eastern Asia | 100.0 /100 | #24 | Exceptional 67.5% |
| Immigrants | Nicaragua | 100.0 /100 | #25 | Exceptional 67.5% |
| Immigrants | India | 100.0 /100 | #26 | Exceptional 67.4% |
| Hispanics or Latinos | 100.0 /100 | #27 | Exceptional 67.4% |
| Hawaiians | 100.0 /100 | #28 | Exceptional 67.4% |
| Nicaraguans | 100.0 /100 | #29 | Exceptional 67.4% |
| Immigrants | Peru | 100.0 /100 | #30 | Exceptional 67.2% |
| Immigrants | Latin America | 100.0 /100 | #31 | Exceptional 67.2% |