Tongan vs Immigrants from Nigeria Births to Unmarried Women

COMPARE

Tongan
Race
Ancestry
AfghanAfricanAlaska NativeAlaskan AthabascanAlbanianAleutAlsatianAmericanApacheArabArapahoArgentineanArmenianAssyrian/Chaldean/SyriacAustralianAustrianBahamianBangladeshiBarbadianBasqueBelgianBelizeanBermudanBhutaneseBlackfeetBolivianBrazilianBritishBritish West IndianBulgarianBurmeseCajunCambodianCanadianCape VerdeanCarpatho RusynCelticCentral AmericanCentral American IndianCherokeeCheyenneChickasawChileanChineseChippewaChoctawColombianColvilleComancheCosta RicanCreeCreekCroatianCrowCubanCypriotCzechCzechoslovakianDanishDelawareDominicanDutchDutch West IndianEastern EuropeanEcuadorianEgyptianEnglishEstonianEthiopianEuropeanFijianFilipinoFinnishFrenchFrench American IndianFrench CanadianGermanGerman RussianGhanaianGreekGuamanian/ChamorroGuatemalanGuyaneseHaitianHmongHonduranHopiHoumaHungarianIcelanderIndian (Asian)IndonesianInupiatIranianIraqiIrishIroquoisIsraeliItalianJamaicanJapaneseJordanianKenyanKiowaKoreanLaotianLatvianLebaneseLiberianLithuanianLumbeeLuxembourgerMacedonianMalaysianMalteseMarshalleseMenomineeMexicanMexican American IndianMongolianMoroccanNative HawaiianNavajoNepaleseNew ZealanderNicaraguanNigerianNorthern EuropeanNorwegianOkinawanOsageOttawaPaiutePakistaniPalestinianPanamanianParaguayanPennsylvania GermanPeruvianPimaPolishPortuguesePotawatomiPuebloPuerto RicanPuget Sound SalishRomanianRussianSalvadoranSamoanScandinavianScotch-IrishScottishSeminoleSenegaleseSerbianShoshoneSierra LeoneanSiouxSlavicSlovakSloveneSomaliSouth AfricanSouth AmericanSouth American IndianSoviet UnionSpaniardSpanishSpanish AmericanSpanish American IndianSri LankanSubsaharan AfricanSudaneseSwedishSwissSyrianTaiwaneseThaiTlingit-HaidaTohono O'OdhamTonganTrinidadian and TobagonianTsimshianTurkishU.S. Virgin IslanderUgandanUkrainianUruguayanUteVenezuelanVietnameseWelshWest IndianYakamaYaquiYugoslavianYumanYup'ikZimbabwean
Immigration
NonimmigrantsImmigrantsAfghanistanAfricaAlbaniaArgentinaArmeniaAsiaAustraliaAustriaBahamasBangladeshBarbadosBelarusBelgiumBelizeBoliviaBosnia and HerzegovinaBrazilBulgariaBurma/MyanmarCabo VerdeCambodiaCameroonCanadaCaribbeanCentral AmericaChileChinaColombiaCongoCosta RicaCroatiaCubaCzechoslovakiaDenmarkDominicaDominican RepublicEastern AfricaEastern AsiaEastern EuropeEcuadorEgyptEl SalvadorEnglandEritreaEthiopiaEuropeFijiFranceGermanyGhanaGreeceGrenadaGuatemalaGuyanaHaitiHondurasHong KongHungaryIndiaIndonesiaIranIraqIrelandIsraelItalyJamaicaJapanJordanKazakhstanKenyaKoreaKuwaitLaosLatin AmericaLatviaLebanonLiberiaLithuaniaMalaysiaMexicoMicronesiaMiddle AfricaMoldovaMoroccoNepalNetherlandsNicaraguaNorth AmericaNorth MacedoniaNorthern AfricaNorthern EuropeNorwayOceaniaPakistanPanamaPeruPhilippinesPolandPortugalRomaniaRussiaSaudi ArabiaScotlandSenegalSerbiaSierra LeoneSingaporeSomaliaSouth AfricaSouth AmericaSouth Central AsiaSouth Eastern AsiaSouthern EuropeSpainSri LankaSt. Vincent and the GrenadinesSudanSwedenSwitzerlandSyriaTaiwanThailandTrinidad and TobagoTurkeyUgandaUkraineUruguayUzbekistanVenezuelaVietnamWest IndiesWestern AfricaWestern AsiaWestern EuropeYemenZaireZimbabweAzores
Immigrants from Nigeria
Race
Ancestry
AfghanAfricanAlaska NativeAlaskan AthabascanAlbanianAleutAlsatianAmericanApacheArabArapahoArgentineanArmenianAssyrian/Chaldean/SyriacAustralianAustrianBahamianBangladeshiBarbadianBasqueBelgianBelizeanBermudanBhutaneseBlackfeetBolivianBrazilianBritishBritish West IndianBulgarianBurmeseCajunCambodianCanadianCape VerdeanCarpatho RusynCelticCentral AmericanCentral American IndianCherokeeCheyenneChickasawChileanChineseChippewaChoctawColombianColvilleComancheCosta RicanCreeCreekCroatianCrowCubanCypriotCzechCzechoslovakianDanishDelawareDominicanDutchDutch West IndianEastern EuropeanEcuadorianEgyptianEnglishEstonianEthiopianEuropeanFijianFilipinoFinnishFrenchFrench American IndianFrench CanadianGermanGerman RussianGhanaianGreekGuamanian/ChamorroGuatemalanGuyaneseHaitianHmongHonduranHopiHoumaHungarianIcelanderIndian (Asian)IndonesianInupiatIranianIraqiIrishIroquoisIsraeliItalianJamaicanJapaneseJordanianKenyanKiowaKoreanLaotianLatvianLebaneseLiberianLithuanianLumbeeLuxembourgerMacedonianMalaysianMalteseMarshalleseMenomineeMexicanMexican American IndianMongolianMoroccanNative HawaiianNavajoNepaleseNew ZealanderNicaraguanNigerianNorthern EuropeanNorwegianOkinawanOsageOttawaPaiutePakistaniPalestinianPanamanianParaguayanPennsylvania GermanPeruvianPimaPolishPortuguesePotawatomiPuebloPuerto RicanPuget Sound SalishRomanianRussianSalvadoranSamoanScandinavianScotch-IrishScottishSeminoleSenegaleseSerbianShoshoneSierra LeoneanSiouxSlavicSlovakSloveneSomaliSouth AfricanSouth AmericanSouth American IndianSoviet UnionSpaniardSpanishSpanish AmericanSpanish American IndianSri LankanSubsaharan AfricanSudaneseSwedishSwissSyrianTaiwaneseThaiTlingit-HaidaTohono O'OdhamTrinidadian and TobagonianTsimshianTurkishU.S. Virgin IslanderUgandanUkrainianUruguayanUteVenezuelanVietnameseWelshWest IndianYakamaYaquiYugoslavianYumanYup'ikZimbabwean
Immigration
NonimmigrantsImmigrantsAfghanistanAfricaAlbaniaArgentinaArmeniaAsiaAustraliaAustriaBahamasBangladeshBarbadosBelarusBelgiumBelizeBoliviaBosnia and HerzegovinaBrazilBulgariaBurma/MyanmarCabo VerdeCambodiaCameroonCanadaCaribbeanCentral AmericaChileChinaColombiaCongoCosta RicaCroatiaCubaCzechoslovakiaDenmarkDominicaDominican RepublicEastern AfricaEastern AsiaEastern EuropeEcuadorEgyptEl SalvadorEnglandEritreaEthiopiaEuropeFijiFranceGermanyGhanaGreeceGrenadaGuatemalaGuyanaHaitiHondurasHong KongHungaryIndiaIndonesiaIranIraqIrelandIsraelItalyJamaicaJapanJordanKazakhstanKenyaKoreaKuwaitLaosLatin AmericaLatviaLebanonLiberiaLithuaniaMalaysiaMexicoMicronesiaMiddle AfricaMoldovaMoroccoNepalNetherlandsNicaraguaNigeriaNorth AmericaNorth MacedoniaNorthern AfricaNorthern EuropeNorwayOceaniaPakistanPanamaPeruPhilippinesPolandPortugalRomaniaRussiaSaudi ArabiaScotlandSenegalSerbiaSierra LeoneSingaporeSomaliaSouth AfricaSouth AmericaSouth Central AsiaSouth Eastern AsiaSouthern EuropeSpainSri LankaSt. Vincent and the GrenadinesSudanSwedenSwitzerlandSyriaTaiwanThailandTrinidad and TobagoTurkeyUgandaUkraineUruguayUzbekistanVenezuelaVietnamWest IndiesWestern AfricaWestern AsiaWestern EuropeYemenZaireZimbabweAzores
Births to Unmarried Women
Income
Poverty
Unemployment
Labor Participation
Family Structure
Vehicle Availability
Education Level
Disability

Births to Unmarried Women Comparison

Tongans

Immigrants from Nigeria

Exceptional
Tragic
28.4%
BIRTHS TO UNMARRIED WOMEN
98.8/ 100
METRIC RATING
64th/ 347
METRIC RANK
35.4%
BIRTHS TO UNMARRIED WOMEN
0.7/ 100
METRIC RATING
247th/ 347
METRIC RANK

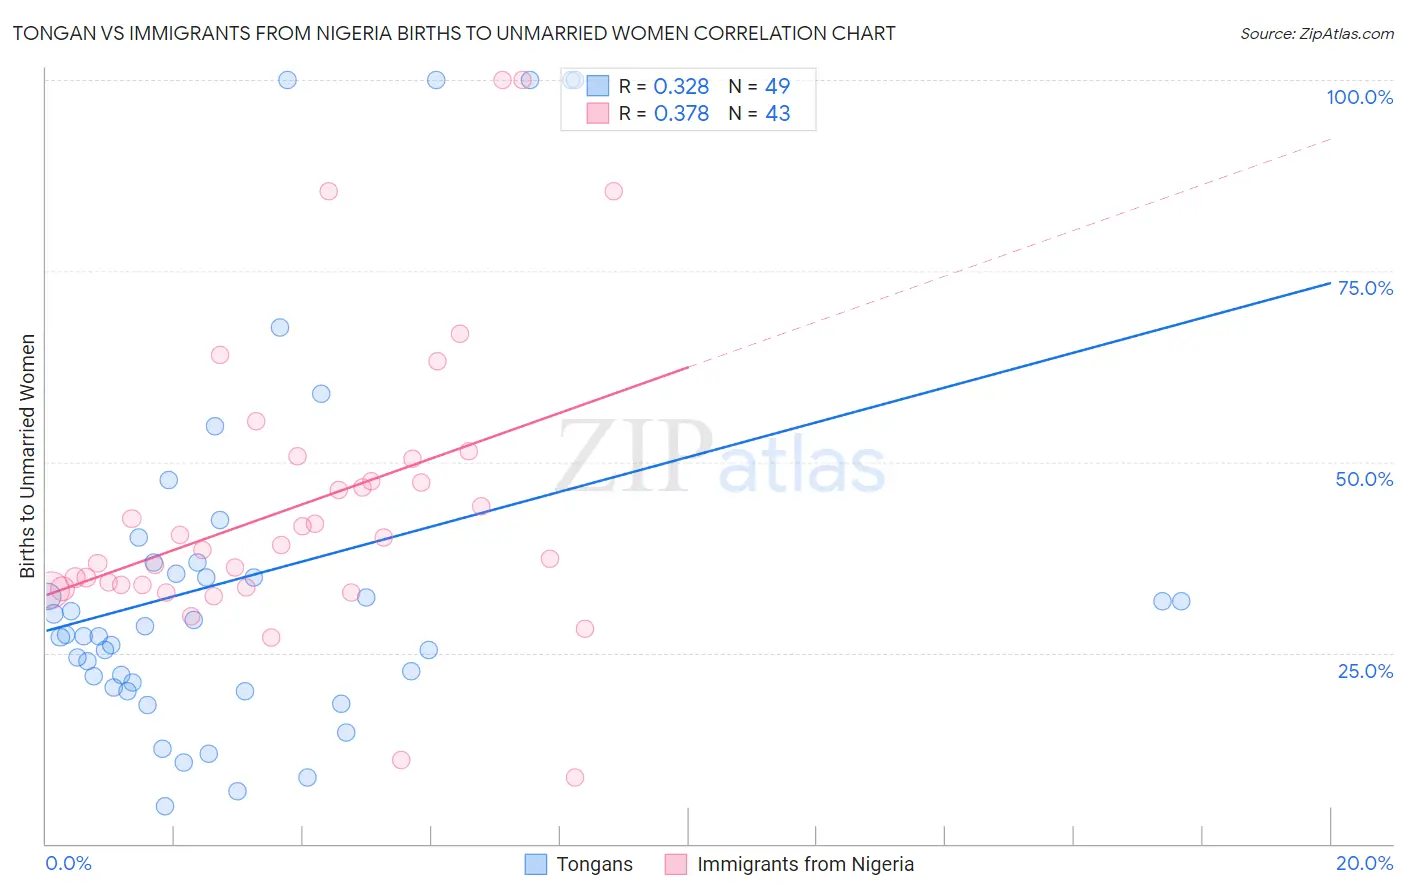
Tongan vs Immigrants from Nigeria Births to Unmarried Women Correlation Chart

The statistical analysis conducted on geographies consisting of 100,697,759 people shows a mild positive correlation between the proportion of Tongans and percentage of births to unmarried women in the United States with a correlation coefficient (R) of 0.328 and weighted average of 28.4%. Similarly, the statistical analysis conducted on geographies consisting of 272,772,821 people shows a mild positive correlation between the proportion of Immigrants from Nigeria and percentage of births to unmarried women in the United States with a correlation coefficient (R) of 0.378 and weighted average of 35.4%, a difference of 24.8%.
Tongan vs Immigrants from Nigeria Births to Unmarried Women

Births to Unmarried Women Correlation Summary

MeasurementTonganImmigrants from Nigeria
Minimum4.9%8.7%
Maximum100.0%100.0%
Range95.1%91.3%
Mean35.2%44.4%
Median27.4%39.0%
Interquartile 25% (IQ1)20.8%33.6%
Interquartile 75% (IQ3)36.8%50.4%
Interquartile Range (IQR)15.9%16.8%
Standard Deviation (Sample)25.3%19.4%
Standard Deviation (Population)25.0%19.2%

Similar Demographics by Births to Unmarried Women

Demographics Similar to Tongans by Births to Unmarried Women

In terms of births to unmarried women, the demographic groups most similar to Tongans are Immigrants from Czechoslovakia (28.4%, a difference of 0.020%), Immigrants from Egypt (28.4%, a difference of 0.040%), Palestinian (28.4%, a difference of 0.15%), Immigrants from Europe (28.4%, a difference of 0.20%), and Bolivian (28.5%, a difference of 0.24%).
DemographicsRating | RankBirths to Unmarried Women
Russians
99.2
/100
|
#57
Exceptional
28.0%
Immigrants | Albania
99.2
/100
|
#58
Exceptional
28.0%
Immigrants | Kazakhstan
99.1
/100
|
#59
Exceptional
28.1%
Immigrants | Turkey
99.1
/100
|
#60
Exceptional
28.1%
Immigrants | North Macedonia
99.1
/100
|
#61
Exceptional
28.1%
Egyptians
99.0
/100
|
#62
Exceptional
28.2%
Immigrants | Serbia
98.9
/100
|
#63
Exceptional
28.3%
Tongans
98.8
/100
|
#64
Exceptional
28.4%
Immigrants | Czechoslovakia
98.8
/100
|
#65
Exceptional
28.4%
Immigrants | Egypt
98.8
/100
|
#66
Exceptional
28.4%
Palestinians
98.7
/100
|
#67
Exceptional
28.4%
Immigrants | Europe
98.7
/100
|
#68
Exceptional
28.4%
Bolivians
98.7
/100
|
#69
Exceptional
28.5%
Laotians
98.6
/100
|
#70
Exceptional
28.5%
Jordanians
98.5
/100
|
#71
Exceptional
28.5%

Demographics Similar to Immigrants from Nigeria by Births to Unmarried Women

In terms of births to unmarried women, the demographic groups most similar to Immigrants from Nigeria are Nigerian (35.3%, a difference of 0.21%), Shoshone (35.3%, a difference of 0.32%), Nonimmigrants (35.5%, a difference of 0.33%), Bermudan (35.5%, a difference of 0.34%), and Guyanese (35.2%, a difference of 0.66%).
DemographicsRating | RankBirths to Unmarried Women
Immigrants | Middle Africa
1.2
/100
|
#240
Tragic
34.9%
Immigrants | Guyana
1.2
/100
|
#241
Tragic
35.0%
Indonesians
1.2
/100
|
#242
Tragic
35.0%
Japanese
0.9
/100
|
#243
Tragic
35.2%
Guyanese
0.9
/100
|
#244
Tragic
35.2%
Shoshone
0.8
/100
|
#245
Tragic
35.3%
Nigerians
0.7
/100
|
#246
Tragic
35.3%
Immigrants | Nigeria
0.7
/100
|
#247
Tragic
35.4%
Immigrants | Nonimmigrants
0.6
/100
|
#248
Tragic
35.5%
Bermudans
0.6
/100
|
#249
Tragic
35.5%
Mexican American Indians
0.4
/100
|
#250
Tragic
35.7%
Immigrants | Western Africa
0.3
/100
|
#251
Tragic
36.0%
Salvadorans
0.3
/100
|
#252
Tragic
36.0%
Immigrants | Portugal
0.2
/100
|
#253
Tragic
36.2%
Potawatomi
0.2
/100
|
#254
Tragic
36.2%