Swiss vs Immigrants from Syria Currently Married

COMPARE

Swiss
Race
Ancestry
AfghanAfricanAlaska NativeAlaskan AthabascanAlbanianAleutAlsatianAmericanApacheArabArapahoArgentineanArmenianAssyrian/Chaldean/SyriacAustralianAustrianBahamianBangladeshiBarbadianBasqueBelgianBelizeanBermudanBhutaneseBlackfeetBolivianBrazilianBritishBritish West IndianBulgarianBurmeseCajunCambodianCanadianCape VerdeanCarpatho RusynCelticCentral AmericanCentral American IndianCherokeeCheyenneChickasawChileanChineseChippewaChoctawColombianColvilleComancheCosta RicanCreeCreekCroatianCrowCubanCypriotCzechCzechoslovakianDanishDelawareDominicanDutchDutch West IndianEastern EuropeanEcuadorianEgyptianEnglishEstonianEthiopianEuropeanFijianFilipinoFinnishFrenchFrench American IndianFrench CanadianGermanGerman RussianGhanaianGreekGuamanian/ChamorroGuatemalanGuyaneseHaitianHmongHonduranHopiHoumaHungarianIcelanderIndian (Asian)IndonesianInupiatIranianIraqiIrishIroquoisIsraeliItalianJamaicanJapaneseJordanianKenyanKiowaKoreanLaotianLatvianLebaneseLiberianLithuanianLumbeeLuxembourgerMacedonianMalaysianMalteseMarshalleseMenomineeMexicanMexican American IndianMongolianMoroccanNative HawaiianNavajoNepaleseNew ZealanderNicaraguanNigerianNorthern EuropeanNorwegianOkinawanOsageOttawaPaiutePakistaniPalestinianPanamanianParaguayanPennsylvania GermanPeruvianPimaPolishPortuguesePotawatomiPuebloPuerto RicanPuget Sound SalishRomanianRussianSalvadoranSamoanScandinavianScotch-IrishScottishSeminoleSenegaleseSerbianShoshoneSierra LeoneanSiouxSlavicSlovakSloveneSomaliSouth AfricanSouth AmericanSouth American IndianSoviet UnionSpaniardSpanishSpanish AmericanSpanish American IndianSri LankanSubsaharan AfricanSudaneseSwedishSwissSyrianTaiwaneseThaiTlingit-HaidaTohono O'OdhamTonganTrinidadian and TobagonianTsimshianTurkishU.S. Virgin IslanderUgandanUkrainianUruguayanUteVenezuelanVietnameseWelshWest IndianYakamaYaquiYugoslavianYumanYup'ikZimbabwean
Immigration
NonimmigrantsImmigrantsAfghanistanAfricaAlbaniaArgentinaArmeniaAsiaAustraliaAustriaBahamasBangladeshBarbadosBelarusBelgiumBelizeBoliviaBosnia and HerzegovinaBrazilBulgariaBurma/MyanmarCabo VerdeCambodiaCameroonCanadaCaribbeanCentral AmericaChileChinaColombiaCongoCosta RicaCroatiaCubaCzechoslovakiaDenmarkDominicaDominican RepublicEastern AfricaEastern AsiaEastern EuropeEcuadorEgyptEl SalvadorEnglandEritreaEthiopiaEuropeFijiFranceGermanyGhanaGreeceGrenadaGuatemalaGuyanaHaitiHondurasHong KongHungaryIndiaIndonesiaIranIraqIrelandIsraelItalyJamaicaJapanJordanKazakhstanKenyaKoreaKuwaitLaosLatin AmericaLatviaLebanonLiberiaLithuaniaMalaysiaMexicoMicronesiaMiddle AfricaMoldovaMoroccoNepalNetherlandsNicaraguaNigeriaNorth AmericaNorth MacedoniaNorthern AfricaNorthern EuropeNorwayOceaniaPakistanPanamaPeruPhilippinesPolandPortugalRomaniaRussiaSaudi ArabiaScotlandSenegalSerbiaSierra LeoneSingaporeSomaliaSouth AfricaSouth AmericaSouth Central AsiaSouth Eastern AsiaSouthern EuropeSpainSri LankaSt. Vincent and the GrenadinesSudanSwedenSwitzerlandTaiwanThailandTrinidad and TobagoTurkeyUgandaUkraineUruguayUzbekistanVenezuelaVietnamWest IndiesWestern AfricaWestern AsiaWestern EuropeYemenZaireZimbabweAzores
Immigrants from Syria
Race
Ancestry
AfghanAfricanAlaska NativeAlaskan AthabascanAlbanianAleutAlsatianAmericanApacheArabArapahoArgentineanArmenianAssyrian/Chaldean/SyriacAustralianAustrianBahamianBangladeshiBarbadianBasqueBelgianBelizeanBermudanBhutaneseBlackfeetBolivianBrazilianBritishBritish West IndianBulgarianBurmeseCajunCambodianCanadianCape VerdeanCarpatho RusynCelticCentral AmericanCentral American IndianCherokeeCheyenneChickasawChileanChineseChippewaChoctawColombianColvilleComancheCosta RicanCreeCreekCroatianCrowCubanCypriotCzechCzechoslovakianDanishDelawareDominicanDutchDutch West IndianEastern EuropeanEcuadorianEgyptianEnglishEstonianEthiopianEuropeanFijianFilipinoFinnishFrenchFrench American IndianFrench CanadianGermanGerman RussianGhanaianGreekGuamanian/ChamorroGuatemalanGuyaneseHaitianHmongHonduranHopiHoumaHungarianIcelanderIndian (Asian)IndonesianInupiatIranianIraqiIrishIroquoisIsraeliItalianJamaicanJapaneseJordanianKenyanKiowaKoreanLaotianLatvianLebaneseLiberianLithuanianLumbeeLuxembourgerMacedonianMalaysianMalteseMarshalleseMenomineeMexicanMexican American IndianMongolianMoroccanNative HawaiianNavajoNepaleseNew ZealanderNicaraguanNigerianNorthern EuropeanNorwegianOkinawanOsageOttawaPaiutePakistaniPalestinianPanamanianParaguayanPennsylvania GermanPeruvianPimaPolishPortuguesePotawatomiPuebloPuerto RicanPuget Sound SalishRomanianRussianSalvadoranSamoanScandinavianScotch-IrishScottishSeminoleSenegaleseSerbianShoshoneSierra LeoneanSiouxSlavicSlovakSloveneSomaliSouth AfricanSouth AmericanSouth American IndianSoviet UnionSpaniardSpanishSpanish AmericanSpanish American IndianSri LankanSubsaharan AfricanSudaneseSwedishSyrianTaiwaneseThaiTlingit-HaidaTohono O'OdhamTonganTrinidadian and TobagonianTsimshianTurkishU.S. Virgin IslanderUgandanUkrainianUruguayanUteVenezuelanVietnameseWelshWest IndianYakamaYaquiYugoslavianYumanYup'ikZimbabwean
Immigration
NonimmigrantsImmigrantsAfghanistanAfricaAlbaniaArgentinaArmeniaAsiaAustraliaAustriaBahamasBangladeshBarbadosBelarusBelgiumBelizeBoliviaBosnia and HerzegovinaBrazilBulgariaBurma/MyanmarCabo VerdeCambodiaCameroonCanadaCaribbeanCentral AmericaChileChinaColombiaCongoCosta RicaCroatiaCubaCzechoslovakiaDenmarkDominicaDominican RepublicEastern AfricaEastern AsiaEastern EuropeEcuadorEgyptEl SalvadorEnglandEritreaEthiopiaEuropeFijiFranceGermanyGhanaGreeceGrenadaGuatemalaGuyanaHaitiHondurasHong KongHungaryIndiaIndonesiaIranIraqIrelandIsraelItalyJamaicaJapanJordanKazakhstanKenyaKoreaKuwaitLaosLatin AmericaLatviaLebanonLiberiaLithuaniaMalaysiaMexicoMicronesiaMiddle AfricaMoldovaMoroccoNepalNetherlandsNicaraguaNigeriaNorth AmericaNorth MacedoniaNorthern AfricaNorthern EuropeNorwayOceaniaPakistanPanamaPeruPhilippinesPolandPortugalRomaniaRussiaSaudi ArabiaScotlandSenegalSerbiaSierra LeoneSingaporeSomaliaSouth AfricaSouth AmericaSouth Central AsiaSouth Eastern AsiaSouthern EuropeSpainSri LankaSt. Vincent and the GrenadinesSudanSwedenSwitzerlandSyriaTaiwanThailandTrinidad and TobagoTurkeyUgandaUkraineUruguayUzbekistanVenezuelaVietnamWest IndiesWestern AfricaWestern AsiaWestern EuropeYemenZaireZimbabweAzores
Currently Married
Income
Poverty
Unemployment
Labor Participation
Family Structure
Vehicle Availability
Education Level
Disability

Currently Married Comparison

Swiss

Immigrants from Syria

Exceptional
Average
49.7%
CURRENTLY MARRIED
99.9/ 100
METRIC RATING
12th/ 347
METRIC RANK
46.8%
CURRENTLY MARRIED
59.3/ 100
METRIC RATING
166th/ 347
METRIC RANK

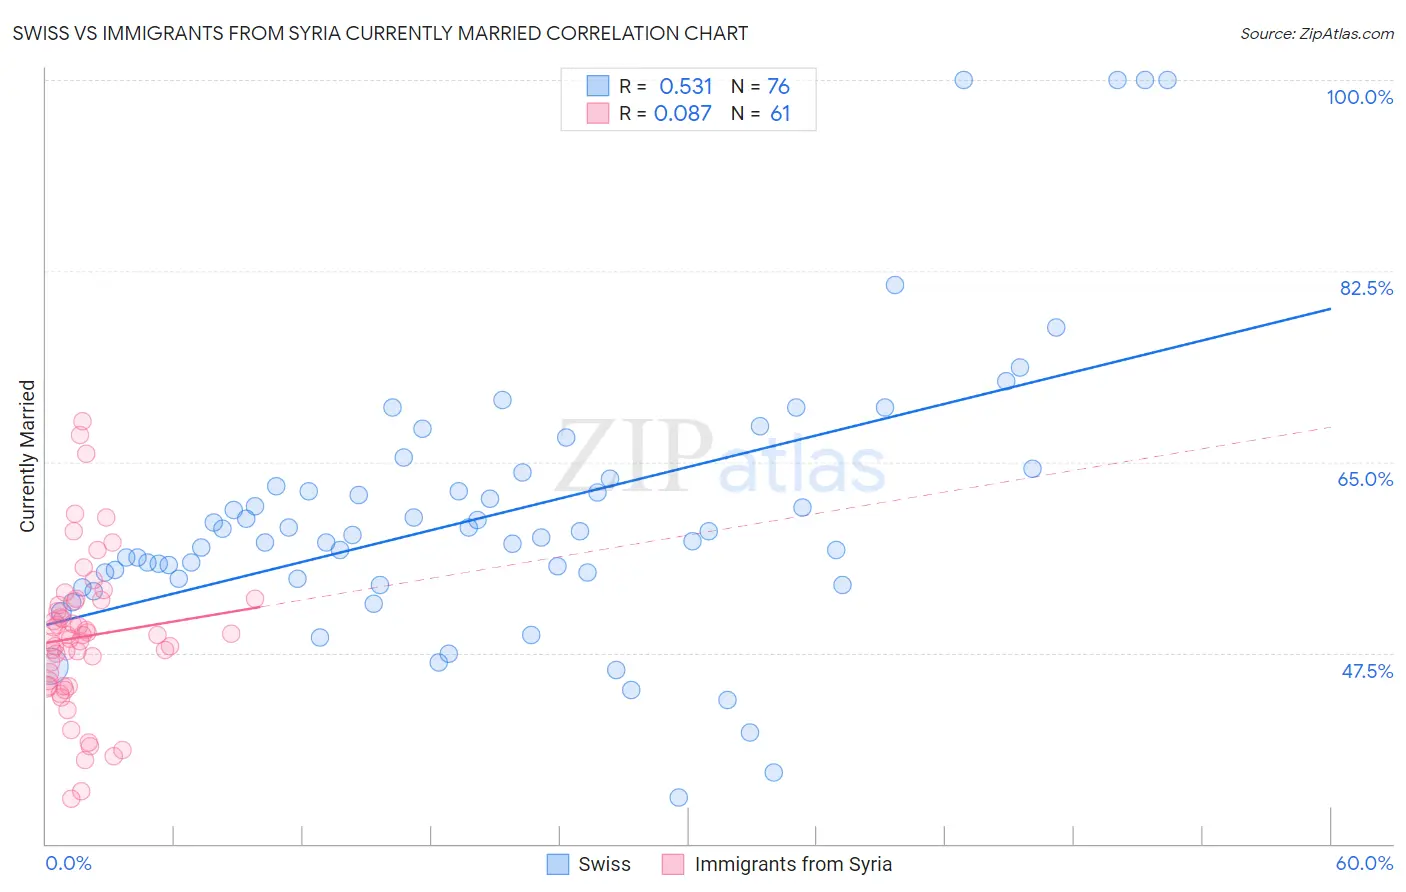
Swiss vs Immigrants from Syria Currently Married Correlation Chart

The statistical analysis conducted on geographies consisting of 464,962,808 people shows a substantial positive correlation between the proportion of Swiss and percentage of population currently married in the United States with a correlation coefficient (R) of 0.531 and weighted average of 49.7%. Similarly, the statistical analysis conducted on geographies consisting of 174,114,575 people shows a slight positive correlation between the proportion of Immigrants from Syria and percentage of population currently married in the United States with a correlation coefficient (R) of 0.087 and weighted average of 46.8%, a difference of 6.3%.
Swiss vs Immigrants from Syria Currently Married

Currently Married Correlation Summary

MeasurementSwissImmigrants from Syria
Minimum34.3%34.1%
Maximum100.0%68.7%
Range65.7%34.6%
Mean60.1%49.0%
Median58.2%49.1%
Interquartile 25% (IQ1)54.3%44.5%
Interquartile 75% (IQ3)63.1%52.2%
Interquartile Range (IQR)8.8%7.8%
Standard Deviation (Sample)12.7%7.0%
Standard Deviation (Population)12.6%7.0%

Similar Demographics by Currently Married

Demographics Similar to Swiss by Currently Married

In terms of currently married, the demographic groups most similar to Swiss are English (49.7%, a difference of 0.0%), Filipino (49.7%, a difference of 0.020%), Dutch (49.6%, a difference of 0.26%), Czech (49.9%, a difference of 0.27%), and German (49.6%, a difference of 0.28%).
DemographicsRating | RankCurrently Married
Danes
100.0
/100
|
#5
Exceptional
50.5%
Norwegians
100.0
/100
|
#6
Exceptional
50.2%
Immigrants | South Central Asia
100.0
/100
|
#7
Exceptional
50.0%
Swedes
100.0
/100
|
#8
Exceptional
50.0%
Czechs
99.9
/100
|
#9
Exceptional
49.9%
Filipinos
99.9
/100
|
#10
Exceptional
49.7%
English
99.9
/100
|
#11
Exceptional
49.7%
Swiss
99.9
/100
|
#12
Exceptional
49.7%
Dutch
99.9
/100
|
#13
Exceptional
49.6%
Germans
99.9
/100
|
#14
Exceptional
49.6%
Pennsylvania Germans
99.9
/100
|
#15
Exceptional
49.6%
Chinese
99.9
/100
|
#16
Exceptional
49.5%
Scandinavians
99.9
/100
|
#17
Exceptional
49.5%
Immigrants | Scotland
99.8
/100
|
#18
Exceptional
49.3%
Europeans
99.8
/100
|
#19
Exceptional
49.3%

Demographics Similar to Immigrants from Syria by Currently Married

In terms of currently married, the demographic groups most similar to Immigrants from Syria are Samoan (46.8%, a difference of 0.020%), Spaniard (46.8%, a difference of 0.020%), Immigrants from Afghanistan (46.8%, a difference of 0.040%), Armenian (46.8%, a difference of 0.040%), and Immigrants from Latvia (46.7%, a difference of 0.10%).
DemographicsRating | RankCurrently Married
Iraqis
66.4
/100
|
#159
Good
46.9%
Immigrants | Uzbekistan
66.0
/100
|
#160
Good
46.9%
Immigrants | Southern Europe
65.9
/100
|
#161
Good
46.9%
Immigrants | Nonimmigrants
65.4
/100
|
#162
Good
46.9%
Delaware
64.7
/100
|
#163
Good
46.9%
Immigrants | Western Asia
64.2
/100
|
#164
Good
46.9%
Samoans
59.8
/100
|
#165
Average
46.8%
Immigrants | Syria
59.3
/100
|
#166
Average
46.8%
Spaniards
58.8
/100
|
#167
Average
46.8%
Immigrants | Afghanistan
58.2
/100
|
#168
Average
46.8%
Armenians
58.2
/100
|
#169
Average
46.8%
Immigrants | Latvia
56.7
/100
|
#170
Average
46.7%
Immigrants | Zimbabwe
52.4
/100
|
#171
Average
46.7%
Aleuts
52.0
/100
|
#172
Average
46.7%
Tlingit-Haida
51.2
/100
|
#173
Average
46.7%